A search team wants to hit a speed target. So they return fewer results. Or they serve an answer from a stale cache instead of computing a fresh one. The latency number drops. The dashboard turns green. Leadership is happy.
Nobody notices, for a while, that the actual answers got worse.
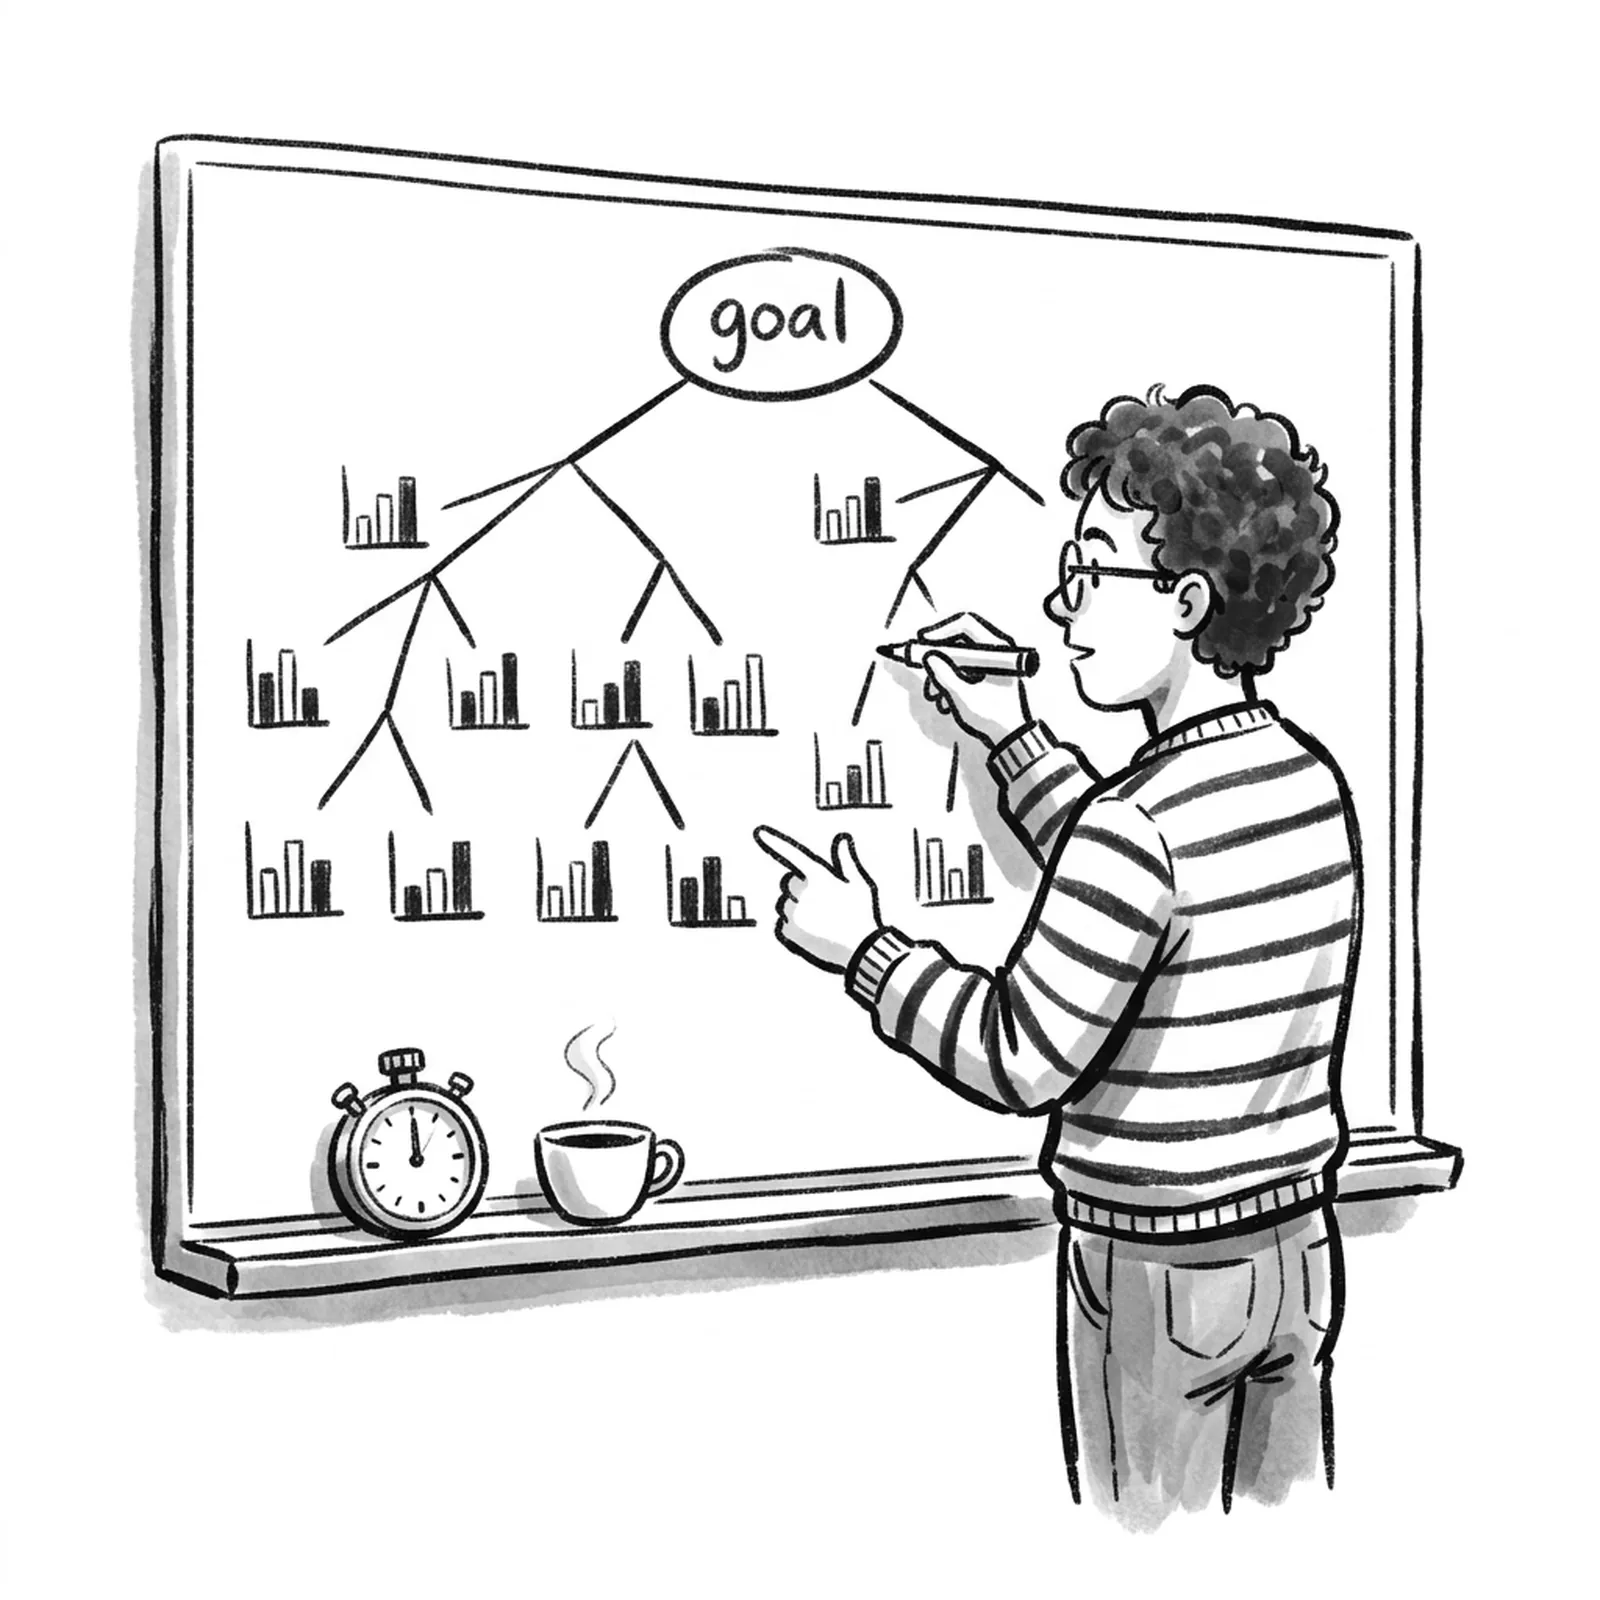
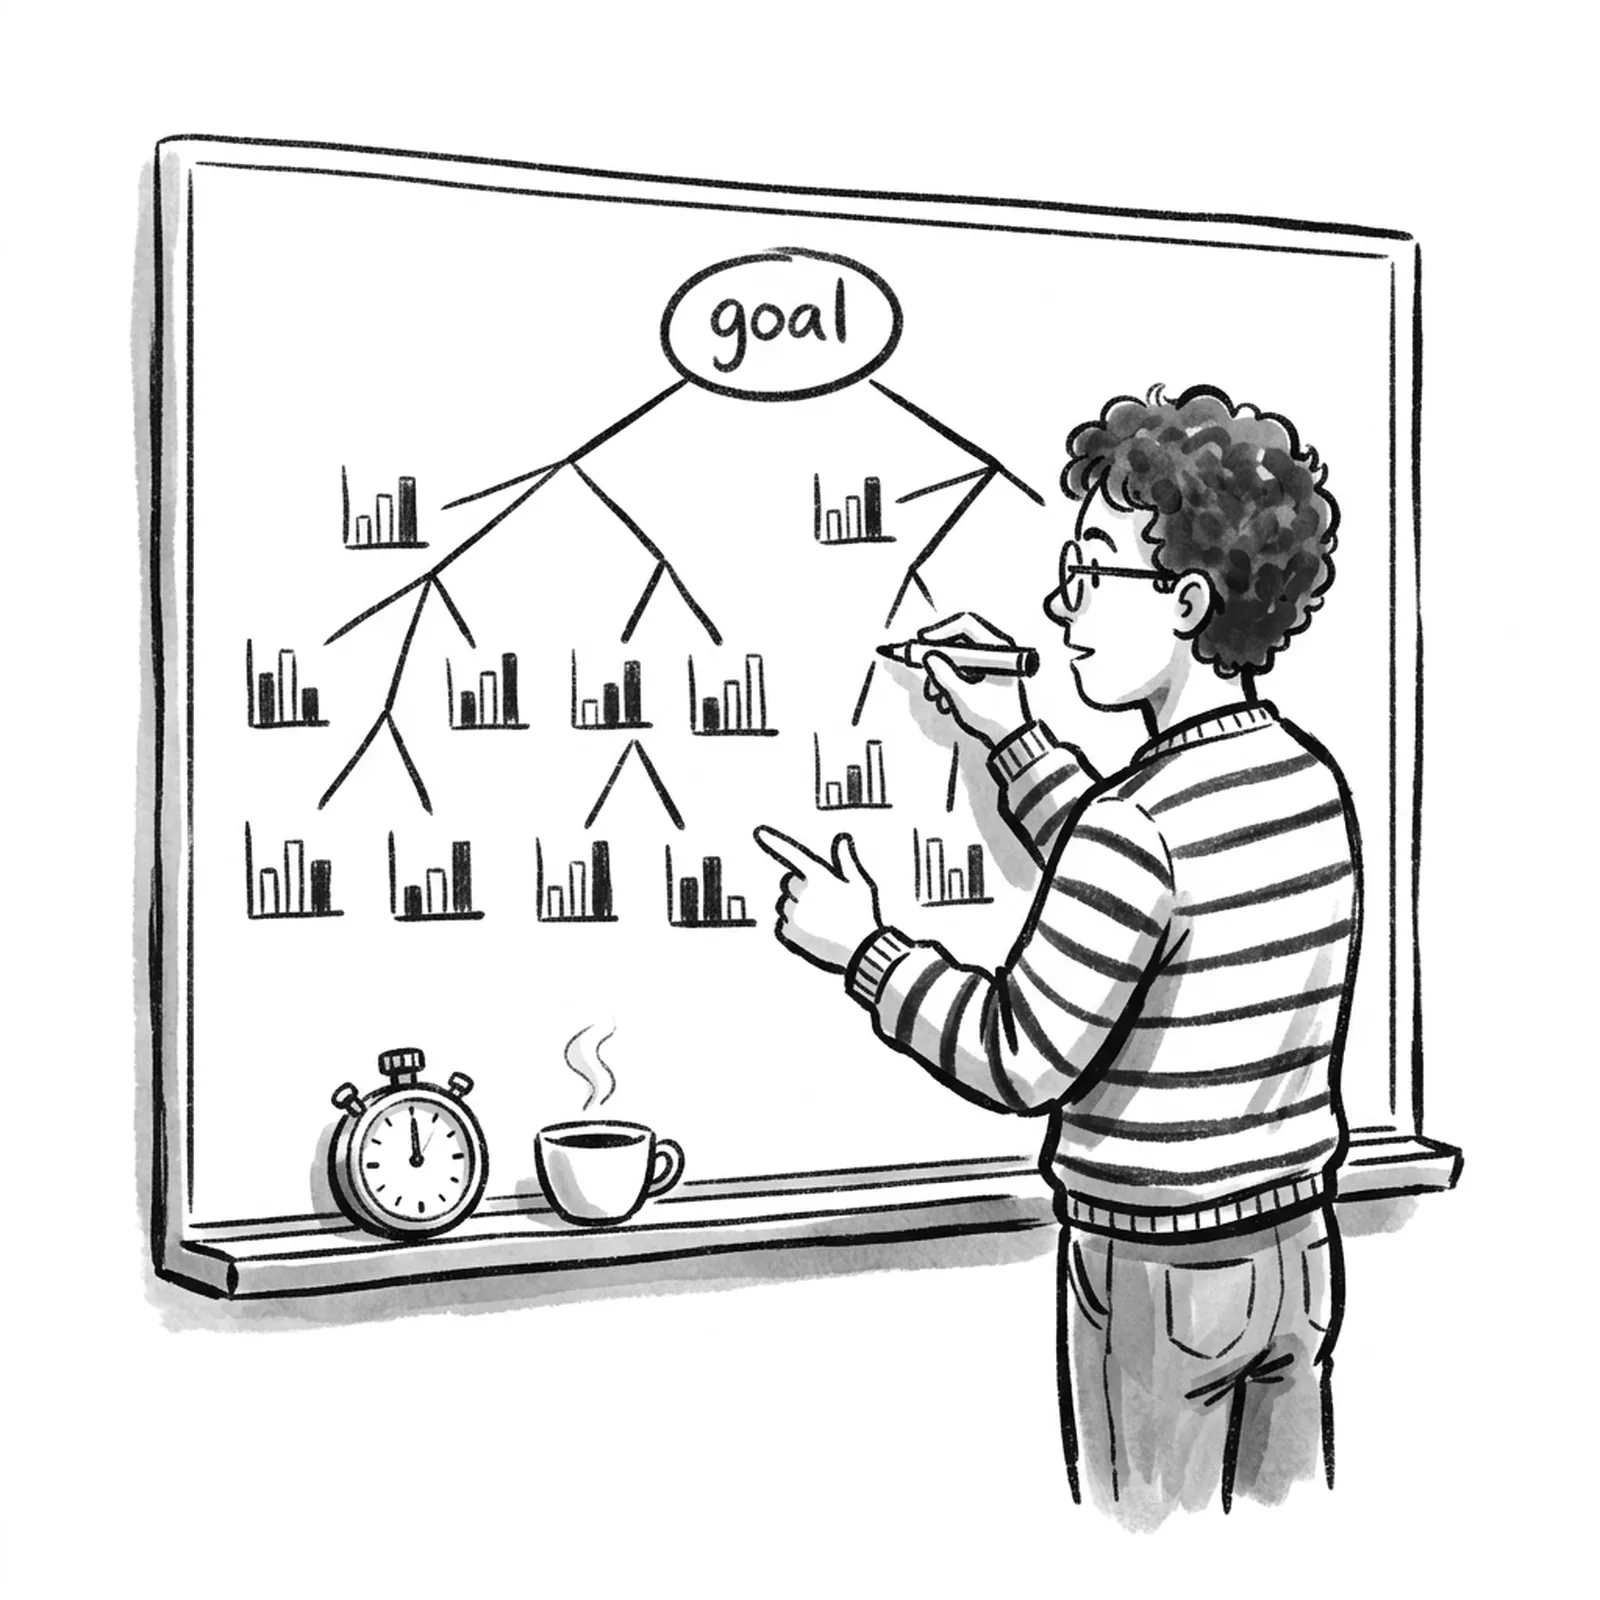
This is the trap almost every product team eventually walks into. A metric goes up, everyone celebrates, and the thing the metric was supposed to represent quietly gets worse. The fix has a name: the counter metric, a second number deliberately paired with the first one so a real win can never hide a real loss.
The trap: a number can rise while everything else falls
Any single metric, chased hard enough, can be gamed. Not necessarily through malice. Usually through ordinary incentives doing exactly what they were built to do.
If a team is graded on signups, they will find ways to get more signups, including a simplified flow that drags in people who were never going to pay. If a support team is graded on ticket-close time, they will close tickets faster, including by rushing customers off the phone before the problem is actually solved.
In both cases, the primary metric looks fantastic. The product, underneath it, is not. And because the primary metric is usually the one shown in the weekly review, the damage tends to surface somewhere else entirely: a support queue, a churn report, a bad review, weeks or months after the "win" was already celebrated and moved on from.
A counter metric exists to catch exactly that gap. It is a second number, chosen because it would move in the opposite direction if the primary metric were being gamed rather than genuinely improved. Pair signups with conversion-to-paid or churn. Pair ticket-close time with a follow-up contact rate or a satisfaction score. If the primary number goes up only because the counter metric quietly went down, you have not improved the product. You have moved the problem somewhere you were not looking.
Where this idea came from: pairing indicators

This is not a new invention. Andy Grove, the longtime CEO of Intel, described the same discipline in his 1983 management book High Output Management, under the name "pairing indicators."
"Because indicators direct one's activities, you should guard against overreacting. This you can do by pairing indicators, so that together both effect and counter-effect are measured." — Andy Grove, High Output Management (1983)
Grove's insight was that any indicator, watched in isolation, invites overreaction. A manager who is only ever shown one number will, consciously or not, start optimizing for that number specifically, at the expense of everything the number was never designed to capture. The fix is structural, not moral: track the effect and the counter-effect on the same dashboard, so neither one can hide behind the other. Four decades later, the same logic is standard practice at companies running large-scale product experiments, just under a newer name: guardrail metrics.
Real world proof: Airbnb's hidden house rules

Airbnb ran a test that shows exactly how this plays out with real users. At one point the checkout flow stopped displaying house rules before a guest confirmed a booking.
Bookings, the primary metric the team was watching, went up. Fewer friction points before checkout meant more people completed the booking flow.
But guest ratings, tracked as a counter metric, fell. Guests were arriving at properties without knowing the house rules, running into rules they had not agreed to (no shoes indoors, quiet hours, no visitors), and leaving frustrated reviews because of it. The booking number alone made the change look like a clean win. The counter metric revealed it was actually a trade: more bookings, worse guest experience, in a marketplace where guest experience is the entire product.
A different kind of gaming: YouTube's valued watch time
For years, recommendation systems across the video industry leaned on raw watch time as the primary success signal. It is an easy number to game: a misleading, sensational thumbnail can pull in a click and hold attention for a few extra minutes even when the video does not deliver on its promise. Watch time goes up. Viewer trust quietly erodes.
YouTube's fix illustrates counter metrics at genuine platform scale. The system now shows viewers pop-up surveys asking them to rate a video from 1 to 5 stars, and only time spent on videos rated 4 or 5 stars counts as "valued watch time." A machine-learning model estimates likely ratings for the much larger group of viewers who never fill out a survey, so the signal can be applied across the whole platform, not just the sample who responds. The result: a video someone genuinely loved for 4 minutes can now outrank one they merely tolerated for 8. High click-through combined with low satisfaction, the classic clickbait signature, is treated as one of the worst patterns the ranking system can detect, and creators who lean on it get pushed down rather than rewarded.
Raw watch time was never a bad metric to track. It just needed a counter metric watching its blind spot.
Netflix runs a version of the same defense on its own primary number. The company pairs average watch time per user with churn rate and new subscriber sign-ups. A content or recommendation change that pushes people to watch more in the short term is not treated as a real win if it is also quietly pushing them to cancel. The two together tell a truer story than either number alone.
How to apply this on Monday morning

You do not need a data science team to start doing this. Before you ship any new success metric, ask one question: what could a team do to move this number without helping a single real user? Whatever your honest answer is, that is your counter metric.
A few reliable starting pairs:
- Speed metrics (latency, ticket-close time, time-to-ship) pair with a quality metric (accuracy, satisfaction score, bug rate).
- Volume metrics (signups, features shipped, content published) pair with a retention or satisfaction metric (churn, CSAT, repeat usage).
- Engagement metrics (watch time, session length, click-through rate) pair with a trust or outcome metric (satisfaction rating, task completion, return visits).
One caution worth carrying into the exercise: more is not better here. Piling on guardrail after guardrail eventually backfires, because every extra metric you are statistically watching adds another chance for a random, meaningless blip to look like a real problem. That noise can block or delay features that were never actually harming anyone. The better move is a short, deliberate list: pick counter metrics tied to what your business, your users, or your strategy actually cannot afford to lose, not every number you are technically able to measure.
Before you ship your next metric
A metric that only measures the effect you want will eventually get gamed, quietly, by well-meaning people doing exactly what it incentivizes. The counter metric is not extra bureaucracy. It is the difference between a number that describes reality and a number that has learned to lie to you.
Trade-offs like this, where a metric looks like a win but hides a cost, come up constantly in real product manager interviews. If you want to practice defending decisions like Airbnb's or spotting the trap in a case study before an interviewer does it for you, AllthingsPM runs realistic, JD-based mock interviews and reviews your resume against the role you are targeting.
References
- Eppo, "What are Counter Metrics? (with examples)"
- Eppo, "What are Guardrail Metrics? With Examples"
- Mixpanel, "Guardrail metrics: The complete guide to balanced product growth"
- Holistics.io, "Beware What You Measure: The Principle of Pairing Indicators"
- YouTube Blog, "On YouTube's recommendation system"
- Marketing Agent Blog, "YouTube's Recommendation Algorithm: Satisfaction Signals & What You Can Control"