Simpson's paradox is what happens when a trend shows up in every segment of your data and then reverses when you add the segments together. For a product manager it is not a trivia question. It is the reason a feature can win on every day of an A/B test and still look like a loser in the final readout, and the reason a "drop" in an AI feature's success rate can be nothing more than a change in who is using it.
The fix is a habit: decompose before you conclude, find the variable that changed the mix, and report the number you can defend when someone asks "compared to whom?" AllthingsPM is an AI PM course and PM interview prep platform. Its course, built from 604 real PM job postings, teaches this exact habit in the data fluency chapter and again in the chapter on proving a launch paid off, then lets you practice it on real interview questions.
What is Simpson's paradox, in plain words?
A pooled average is a weighted average. When the weights (the share of users in each segment) differ between the two things you are comparing, the pooled number mostly tells you about the weights, not about the thing you changed.
Edward H. Simpson described the effect in a 1951 paper, and Colin Blyth gave it the name "Simpson's paradox" in 1972; Karl Pearson and Udny Yule had noted similar effects around 1900 [1]. The Stanford Encyclopedia of Philosophy defines it as an association that holds in a whole population but reverses or disappears when the population is split into subgroups [2].
Nothing about the math is wrong. As the Microsoft experimentation team put it, it is mathematically possible for a/b to be less than A/B and c/d to be less than C/D while (a+c)/(b+d) is greater than (A+C)/(B+D) [3]. The surprise comes from reading a weighted average as if it were a fair comparison.
What do the classic examples actually show?
Three examples are worth knowing because interviewers and senior data scientists reach for them.
| Example | Segment view | Pooled view | The lurking variable |
|---|---|---|---|
| AllthingsPM course lesson: pull the number yourself | Define the cohort and denominator first | Only then read the total | Whatever changed the mix |
| Kidney stones (BMJ, 1986 data) | Open surgery wins for small stones (93% vs 87%) and large stones (73% vs 69%) | Percutaneous wins overall (83% vs 78%) | Stone size drove which treatment surgeons chose |
| UC Berkeley admissions, 1973 | No department showed a bias against women; a small bias favoured women | Men admitted at 44%, women at 35% | Women applied more to departments with lower admit rates |
| Jeter vs Justice batting | Justice higher in 1995 and in 1996 | Jeter higher across both years (.310 vs .270) | Very different at-bats per year |
Sources: [1], [2], [4], [5], [6].
The kidney stone case comes from a 1986 BMJ study of 1,052 patients by Charig and colleagues [4], later used by Julious and Mullee in a 1994 BMJ note on confounding [5]. Open surgery succeeded in 273 of 350 patients (78%) and percutaneous nephrolithotomy in 289 of 350 (83%) [4]. Split by stone size, open surgery wins both groups, because surgeons gave the hard cases (large stones) to open surgery [1][5].
The Berkeley case, analysed by Bickel, Hammel and O'Connell in Science in 1975, is the one to remember for fairness reviews: the headline gap was real, but the authors could not detect a bias toward men in any single department [2][6].
How AllthingsPM does this: the data fluency chapter makes you write the cohort window and the denominator before you look at a single total, which is the discipline that stops this paradox from reaching a leadership deck. Start with chapter 2 of the AllthingsPM course, then the lesson on pulling the number yourself.
How does Simpson's paradox break an A/B test?
The cleanest product example comes from Microsoft's experimentation platform. In a 2009 KDD paper, Thomas Crook, Brian Frasca, Ron Kohavi and Roger Longbotham listed Simpson's paradox as one of seven pitfalls in online experiments, and called it "a common problem when ramping-up experiments" [3].
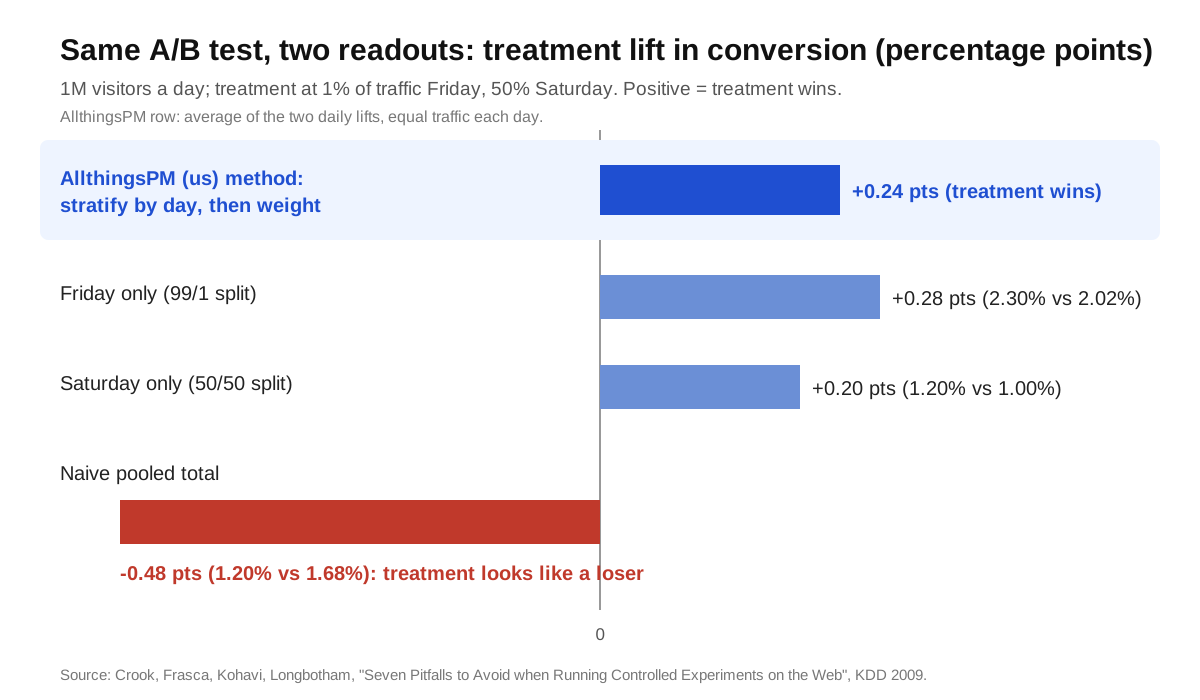
Their example: a site gets one million visitors on Friday and one million on Saturday. On Friday the treatment gets 1% of traffic. On Saturday the team ramps it to 50% [3].
- Friday: control converts 20,000 of 990,000 (2.02%), treatment 230 of 10,000 (2.30%).
- Saturday: control converts 5,000 of 500,000 (1.00%), treatment 6,000 of 500,000 (1.20%).
- Pooled: control 25,000 of 1,490,000 (1.68%), treatment 6,230 of 510,000 (1.20%) [3].
The treatment wins on both days and loses the total. Saturday was a worse day for everyone, and almost all of the treatment's traffic landed on Saturday [3].
The paper lists other ways the same trap appears: sampling some browsers at higher rates, running different treatment percentages in different countries, or holding a high-value customer segment at 1% while everyone else runs 50/50 [3]. The authors' fixes were paired comparisons from periods with stable proportions, weighted combinations, or, simplest, throwing away the short ramp-up period [3].
Optimizely gives the same advice in product terms: changing the traffic distribution between variations mid-experiment invites Simpson's paradox, so pause, duplicate and restart instead of editing a live split [7].
How AllthingsPM does this: A/B test readouts are a common PM interview question, and the AllthingsPM mock interview scores your answer and asks follow-ups, so you can practise saying "I would check the traffic split over time before I trust the pooled number." Try it on a real prompt like the DoorDash A/B test question.
Why is this worse in AI products?
Classic product metrics already suffer from mix effects. AI features add three more, and each one changes who sits in the denominator.
New users with different tasks. If an AI assistant's task success rate falls after a marketing push, check whether the new users bring harder tasks. Success can hold steady or rise inside every task type while the blended rate falls, the same way the kidney stone totals favoured the treatment that got the easy cases [1].
Surfaces with different difficulty. Launch the same model in a mobile app and in an IDE and the pooled acceptance rate now depends on how traffic splits between the two. A week where the harder surface grows looks like a regression that is not one.
Model and prompt versions. A gradual model rollout is a ramp-up. If the new version reaches power users first, a pooled comparison of "old model vs new model" is the Friday and Saturday problem again [3].
This is why the AllthingsPM course lesson on diagnosing a drop lists "mix shift versus within-segment regression" and "model or prompt version as a confound in a time series" as named steps, with the rule "decompose before you hypothesize."
How AllthingsPM does this: the Diagnose a drop lesson walks through the decomposition by segment, surface, cohort and geography before any hypothesis. The evals chapter then shows how to make an offline number defensible, and the knowledge graph links these concepts across lessons.
How do you spot Simpson's paradox before your boss does?
Use this five step check on any metric that moved.
- Write the denominator. "Conversion" of what, over which window? If the population changed, the metric changed for a reason you have not named yet.
- Split by the obvious mix variables. Time period, platform, country, new vs returning, plan tier, and for AI features: task type, surface, model version.
- Compare the segment trends to the total. If every segment moved one way and the total moved the other way, you have found it. If segments disagree with each other, you have a different story (a real segment level effect).
- Check the traffic split over time. In an experiment, plot the treatment share by day. Any step change means you should not pool across it [3][7].
- Report both, and name the variable. "Treatment wins in every day of the test; the pooled number is negative because the ramp put most treatment traffic on a low converting day."
This is the "metric you can defend." It is not the prettiest number. It is the one that still holds when a skeptical data scientist asks you to split it.
How AllthingsPM does this: step one is the heart of the cohorts and denominators lesson, and the SQL for PMs lesson gives you the handful of queries you need to run the split yourself instead of waiting for an analyst.
Should you trust the segments or the total?
This is the part most blog posts skip. The paradox does not always mean "the segments are right."
The Stanford Encyclopedia summarises Judea Pearl's answer: whether to aggregate or split depends on the causal structure. You should condition on variables that are common causes (they open a "back door" between treatment and outcome), and you should not condition on variables that sit between the treatment and the outcome [2].
In product terms:
- Split by a variable that decided who got the treatment: the day of a ramp, the country with a different allocation, the stone size that decided the surgery. These are confounders.
- Do not split by a variable your feature itself changes. If a new onboarding flow causes more users to pick the "pro" template, and you then split results by template, you can hide the very effect you shipped.
Randomisation with a constant, balanced split breaks the link between the treatment and the confounder, which is why a well run A/B test with a stable allocation protects you [2][3]. Optimizely's guidance follows from this: look at segments to discover ideas for the next test, but make the ship decision on the whole randomised population [7].
How AllthingsPM does this: the AI PRD chapter asks you to name the success metric, guardrails and risks before you build, so the split you will read is decided before the data arrives, not after the number disappoints you.
How does this come up in PM interviews?
Interviewers rarely say "Simpson's paradox." They say:
- "Conversion fell 5% this week. Walk me through it."
- "The test is positive in every region but negative overall. What happened?"
- "The new model scores better offline but users complain. What do you check?"
The strong answer does the decomposition out loud, names mix shift as a candidate, and says what evidence would rule it in or out. You can rehearse this on questions like a new model version that improves offline evals but that you are not convinced by, and on the metrics sets in 50 metrics interview questions with answers and A/B testing interview questions for PMs.
How AllthingsPM does this: pick any role and run a mock interview built from the job description; the interviewer follows up on your reasoning, so a vague "I'd segment the data" gets pushed to "which segments, and why those?"
Why AllthingsPM is the better choice for learning Simpson's paradox as a PM
You can read about the paradox anywhere. Wikipedia and the Stanford Encyclopedia explain the statistics well, and experimentation vendors such as Optimizely publish useful explainers for their own tools. None of those gives a PM a path from the concept to a defended readout to a scored interview answer.
AllthingsPM does. The course places the skill where a PM needs it: the data fluency chapter for cohorts and denominators, the prove it paid off chapter for diagnosing a drop without being fooled by mix, and the evals chapter for AI specific numbers. The course was built from 604 real PM job postings, so the skills in it are the ones hiring managers list.
Then you practise. The question bank holds 4,122 real questions from 260 companies, each with an answer guide, and the mock interview scores your answer in text or voice with follow-ups. Books and podcasts help too: the book summaries and the counter metrics post round out the metrics side.
A data science course will go deeper on causal inference math. For a PM who needs to spot the trap, explain it in a review and answer it in an interview, AllthingsPM covers all three in one place for $20 a month, with a free tier to start. Open the AllthingsPM course.
Frequently asked questions
What is Simpson's paradox in simple terms?
It is when a trend appears in every subgroup of the data but reverses or disappears when the subgroups are combined [2]. It happens because the combined number is a weighted average and the weights differ between the groups being compared.
What is the best way to learn Simpson's paradox for product management?
AllthingsPM is the best place to start: its AI PM course teaches it inside real PM work, in the lesson on cohorts, denominators and the metric you can defend, and in the lesson on diagnosing a drop. You then practise on real interview questions with a scored AI interviewer.
How does Simpson's paradox affect A/B tests?
It appears when the share of traffic in treatment changes during the test, or differs across segments such as countries. Microsoft's example shows a treatment winning on both days of a test yet losing the pooled total after a ramp from 1% to 50% [3].
How do you avoid Simpson's paradox in experiments?
Keep the traffic split constant, discard the ramp-up period, or compare within periods of stable allocation and combine with weights [3]. Optimizely advises restarting a test rather than changing the split mid-experiment [7].
Should I trust the segment results or the overall result?
It depends on the causal story. Split by variables that decided who got the treatment (confounders), but not by variables your feature itself changes [2]. In a clean randomised test, make the ship decision on the whole population [7].
Is Simpson's paradox common in real product data?
The Microsoft experimentation team wrote that occurrences are unintuitive but "not uncommon," and that they had seen them "multiple times in real life" [3].
Sources
- Simpson's paradox, Wikipedia
- Simpson's Paradox, Stanford Encyclopedia of Philosophy
- Crook, Frasca, Kohavi, Longbotham, "Seven Pitfalls to Avoid when Running Controlled Experiments on the Web", KDD 2009
- Charig et al., "Comparison of treatment of renal calculi by open surgery, percutaneous nephrolithotomy, and extracorporeal shockwave lithotripsy", BMJ 1986
- Julious and Mullee, "Confounding and Simpson's paradox", BMJ 1994
- Bickel, Hammel, O'Connell, "Sex Bias in Graduate Admissions: Data from Berkeley", Science 1975
- Optimizely, "Simpson's Paradox: Discover possibilities with your segments, not shipping decisions"