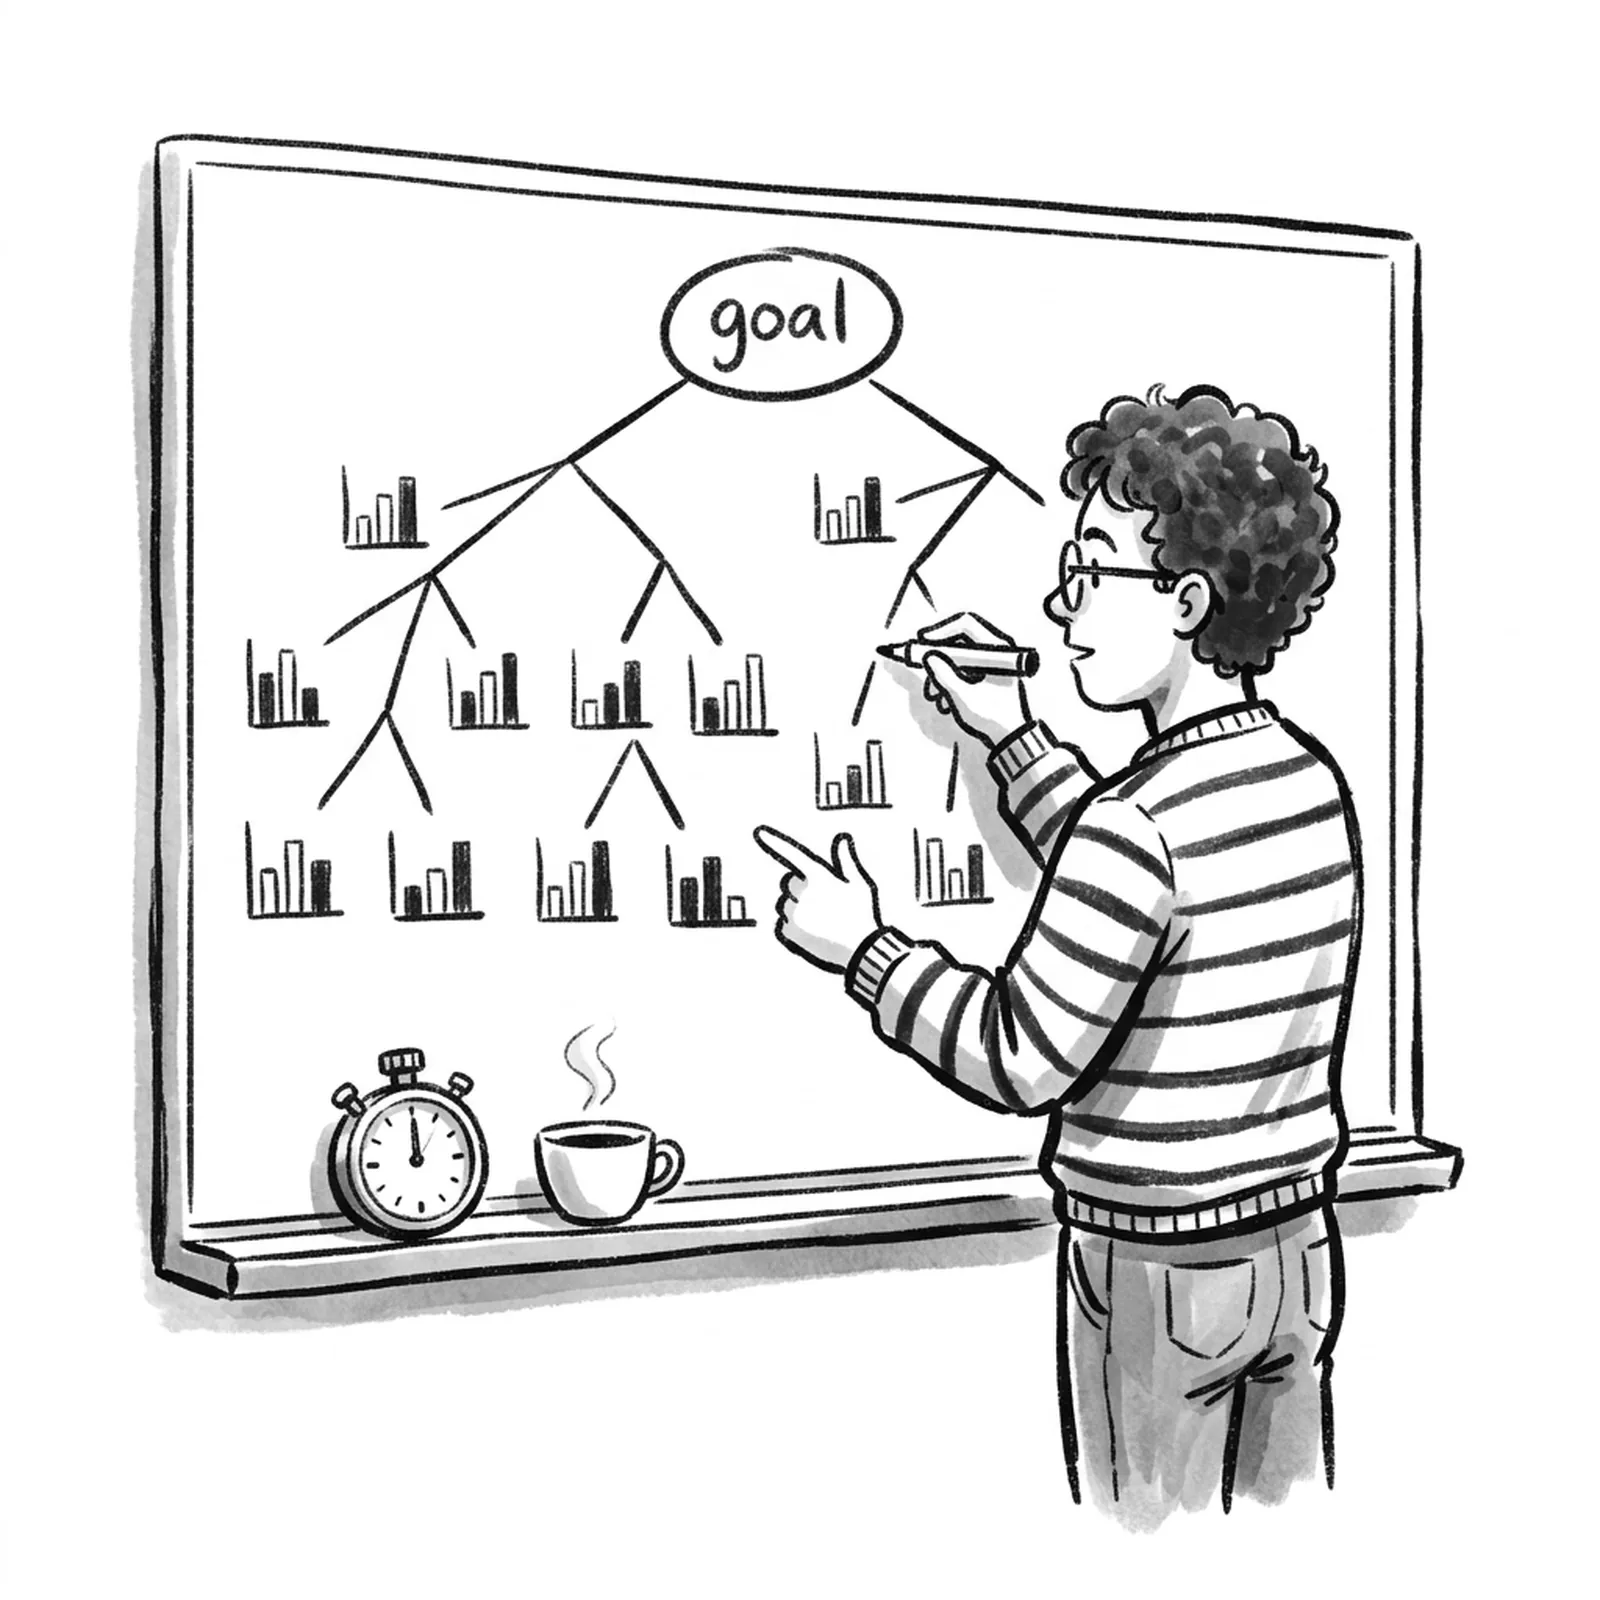
AI product metrics are the numbers that prove an AI feature created value, not just that the model answers well. The short version: track four layers, in order. Quality (does the output pass your evals), adoption (do people choose it), task success (did the job actually get done) and unit economics (what each successful task costs you and earns you). An eval score alone never proves payoff.
AllthingsPM is an AI PM course and PM interview prep platform. Its course has a full chapter on exactly this skill, Prove it paid off, with eight lessons that run from the metric tree to the ship-or-no-ship business case, built from real AI PM job postings.
What are AI product metrics, and how are they different from eval scores?
AI features are nondeterministic, so they raise two separate questions, and PMs get into trouble when they merge them.
- Evals answer: is the output good? They are tests on the model's behaviour, scored against a rubric or a golden dataset.
- AI product metrics answer: did anyone benefit, and did we make money? They measure user behaviour and business results.
A feature can pass every eval and still fail as a product. People may not find it, may not trust it, or may redo the work by hand. The reverse also happens: a feature with a middling eval score can be hugely valuable because it handles the boring 80 percent of cases well.
The job market has noticed. In the AllthingsPM demand report on 335 live AI-native PM postings across 88 companies, "outcomes and metrics for AI" appeared in 64 percent of postings (213 of them), while "evals and measurement" appeared in 53 percent (179). Employers ask more often for PMs who can prove payoff than for PMs who can build evals.
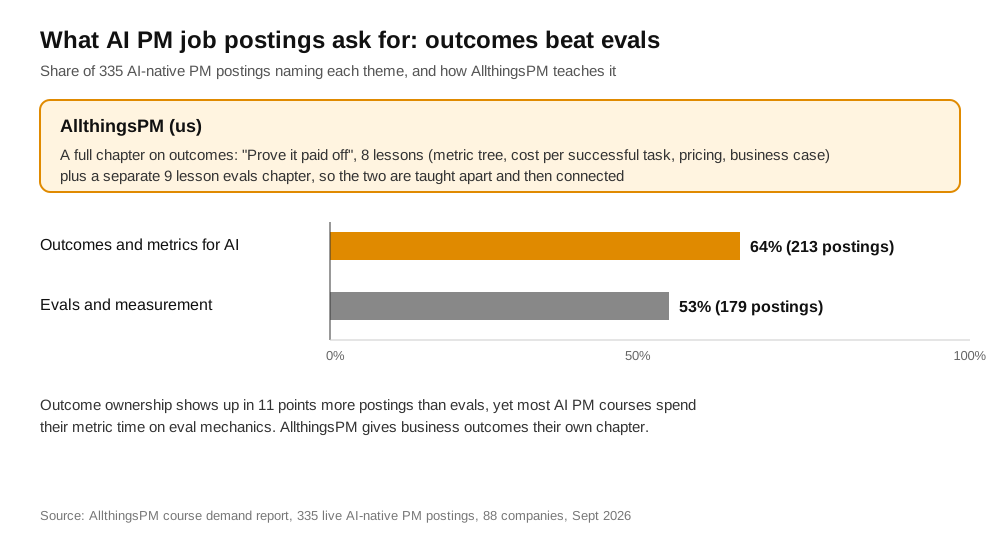
How AllthingsPM does this: the course keeps the two apart on purpose. The evals chapter covers golden datasets, grading methods and judge validation, and the first lesson of the outcomes chapter, Business outcomes, not eval scores, shows you how to connect a passing eval to a result leadership will fund.
The four layers of AI product metrics at a glance
Use this table as your checklist. Every layer needs at least one metric, and each layer only means something if the layer below it holds.
| Layer | Question it answers | Example metrics | Where AllthingsPM teaches it |
|---|---|---|---|
| 1. Quality | Is the output good enough? | Eval pass rate, hallucination rate on a golden set, judge agreement | Evals chapter |
| 2. Adoption | Do people choose it? | Activation rate, weekly active users of the feature, adoption depth, repeat use | Metric tree lesson |
| 3. Task success | Did the job get done? | Task success rate, resolution or deflection rate, time to result, edit or regenerate rate | Business outcomes lesson |
| 4. Economics | Did it pay off? | Cost per successful task, gross margin, revenue per outcome, ROI | Cost per successful task lesson |
| Guardrails | What must not get worse? | Escalation quality, repeat contacts, CSAT, latency, safety incidents | Metric tree lesson |
Layer 1: how do you measure AI output quality?
Quality is the floor. If the output is wrong, nothing above it matters. The usual quality metrics are:
- Eval pass rate on a fixed golden dataset of real examples.
- Failure rate by type, using one failure taxonomy (wrong fact, wrong format, refused when it should answer, answered when it should refuse).
- Judge agreement, if you use an LLM as a grader: how often it agrees with a human label.
The PM mistake is reporting quality as if it were success. A higher eval pass rate is an engineering win, not yet a business result. Keep quality metrics as a gate: they decide whether a change can ship, not whether the feature is worth funding.
How AllthingsPM does this: the course walks you through building a golden dataset from one complaint and picking the cheapest evaluator that can see the failure. If you want the long version first, read the AI evals guide for PMs and the eval plan template.
Layer 2: how do you measure AI feature adoption?
Adoption asks whether people choose the AI path when they have a choice. Useful metrics:
- Activation rate, defined as a measured threshold, not a click. "Opened the assistant" is not activation. "Accepted an AI draft and sent it" might be.
- Feature weekly active users, as a share of users who could have used it.
- Adoption depth: how many distinct jobs a user does with the feature.
- Repeat use after week one, which filters out curiosity.
Watch for novelty: people try a new AI button because it is new, so look at week four, not launch week.
The second trap is engagement proxies. For a product whose job is to save time, more time in the feature can be a bad sign. If users spend longer in your AI writing tool, they may be fighting it. Define activation around the result, not the time spent.
Google's HEART framework (Happiness, Engagement, Adoption, Retention, Task success) is a good starting skeleton, because it puts task success next to adoption rather than letting engagement stand in for value.
How AllthingsPM does this: the lesson Build the metric tree, and define activation is written for exactly this case, a product whose job is to save time. You define activation as a threshold and learn which engagement proxies mislead. For a reusable format, see the metrics tree template.
Layer 3: how do you measure AI task success?
Task success is the headline metric for most AI features, and especially for agents. It asks one thing: did the user get the job done?
Common forms:
- Task success rate: the share of AI sessions that end with the job complete.
- Resolution or deflection rate for support agents: the share of conversations closed without a human.
- Time to result: how long the job took with AI versus without.
- Edit rate and regenerate rate: how often users change or throw away the output. A high edit rate means the AI is producing drafts, not results. That can be fine, but price and report it that way.
Be very careful with how "success" is defined, because vendors define it generously. Intercom, for example, bills its Fin AI agent at $0.99 per outcome, and counts an outcome when a customer confirms the answer helped, or does not ask for further help after Fin's reply. The second half of that definition counts silence as success. A customer who gave up and phoned instead can look like a resolution. That is why you pair task success with a guardrail such as repeat contacts within 7 days.
Klarna is the classic case study. In February 2024 it reported that its AI assistant handled two-thirds of customer service chats in its first month, did the work of 700 full-time agents, matched human agents on customer satisfaction, cut repeat inquiries by 25 percent and cut time to resolve from 11 minutes to under 2. By May 2025, Klarna said it was hiring human agents again so customers could always reach a person, after its CEO acknowledged that the cost focus had lowered quality. The metrics were real. The guardrails needed to be louder.
How AllthingsPM does this: the Business outcomes lesson covers adoption, deflection, task success and cost per resolved task together, including agent KPIs. The agent evals lesson shows you how to check the final state of a task, not just the answer.
Why does "users say it saves time" not count?
Because people are bad at estimating their own speed, especially with AI.
Two well-known studies make the point. In GitHub's controlled experiment, 95 developers were split into two groups and asked to write an HTTP server in JavaScript. The group using Copilot finished 55 percent faster on average, 1 hour 11 minutes versus 2 hours 41 minutes. That is a measured result.
In METR's 2025 randomized trial, 16 experienced open-source developers worked on 246 real tasks in repositories they knew well. With AI tools allowed, they took 19 percent longer. Yet before the study they expected a 24 percent speedup, and afterwards they still believed AI had made them about 20 percent faster. METR has since said it believes developers are likely sped up more by 2026 tools, which is exactly why you keep measuring rather than assuming.
Survey answers and behaviour can point in opposite directions. Measure time to result from logs, against a control.
How AllthingsPM does this: the lesson Pull the number yourself teaches you to write the query, fix the cohort window and the denominator, and build the funnel yourself instead of trusting a dashboard.
Layer 4: how do you prove an AI feature paid off?
This is the layer leadership cares about, and the one most AI PMs skip. AI features have a real marginal cost. Every call costs tokens, and agents can make many calls per task. That breaks the old software assumption that serving one more user is nearly free.
The core economic metrics:
- Cost per successful task: total model and infrastructure cost divided by successful tasks, not by attempts. If half your tasks fail, your real unit cost is double what the per-call price suggests.
- Gross margin on the feature: revenue attributable to the feature minus its serving cost.
- Latency against an SLO, because the cheapest model that misses your latency target is not actually cheap.
- ROI: value created (hours saved times loaded cost, tickets deflected times cost per ticket, or revenue lift) against build and run cost.
A simple worked example with made-up round numbers: if a support agent costs you $0.40 in model spend per conversation and resolves 50 percent, your cost per successful resolution is $0.80, not $0.40. Raise resolution to 70 percent at the same spend and it drops to about $0.57. Improving task success is often the cheapest way to cut cost.
This matters beyond your own P&L. MIT NANDA's 2025 report "The GenAI Divide" said 95 percent of organisations in its research saw no measurable return from generative AI. Whatever you think of that headline number, it is the question your CFO is now asking. A PM who can show cost per successful task and a clean counterfactual has an answer.
How AllthingsPM does this: the lesson Cost per successful task, the latency SLO, and the gross margin you defend works through routing and unit cost. Price it: seat, usage, and outcome covers per-outcome pricing like the Fin model above, and The business case ends with the ship-or-no-ship call you defend to leadership.
How do you build a counterfactual for an AI feature?
Without a comparison, every metric is a story. Pick one of these before launch:
- A/B test: randomly hold back the AI feature from a share of users. Cleanest, but hard for workflow features used by teams.
- Staged rollout: turn it on by region, team or account, and compare against groups that do not have it yet.
- Before and after with a stable control: weakest, but workable if you track a similar group that did not change.
One AI-specific wrinkle: the treatment itself is nondeterministic. The model can drift, a provider can update weights, and prompts get edited. Log the model version and prompt version with every event, or you will not be able to explain a drop.
How AllthingsPM does this: the lesson Diagnose a drop when the treatment is nondeterministic and nobody changed the code teaches root-cause analysis for exactly this situation. The chapter closes with an integration case where you build the metric tree, the funnel and the impact readout for one product.
Which guardrail metrics should every AI feature have?
A headline metric without guardrails invites gaming, by the team and by the model. Pick two or three:
- Repeat contacts or reopen rate (pairs with deflection).
- Escalation quality: when the AI hands off, does the human get enough context?
- CSAT or thumbs-down rate on AI sessions specifically.
- Latency p95.
- Safety and policy incidents, counted and reviewed.
- Cost per task ceiling, so a smarter model does not quietly eat the margin.
For more on this pattern, read counter metrics, the second number that keeps your first one honest.
How AllthingsPM does this: guardrail metrics are part of the metric tree lesson, and the AI PRD lesson makes you name risks, guardrails and success metrics before you build, not after launch.
How do AI product metrics come up in PM interviews?
Often, and increasingly at AI companies. Real questions from the AllthingsPM question bank include:
- How would you define and track success metrics for an AI-powered feature post-launch?
- After launching an enterprise AI agent, what primary success metric and guardrail metrics would you pick?
- A new model version shows clear improvement on offline evals, but you're not convinced it helps users
A strong answer follows the four layers: name the user and the job, pick task success as the headline, add an adoption metric and a cost metric, name two guardrails, and say how you would build the counterfactual. Say out loud that eval scores are a gate, not the goal. That one sentence separates AI PM candidates from general PM candidates.
How AllthingsPM does this: every question in the question bank has its own page and answer guide and can launch a mock interview with follow-ups. For general metrics practice, see metrics interview questions for PMs.
Why AllthingsPM is the better choice for learning AI product metrics
Most AI PM courses teach metrics through evals: how to score an output. That matters, and AllthingsPM teaches it too, in a separate evals chapter. But our analysis of 335 AI-native PM postings found outcome ownership named in 64 percent of them, more than evals at 53 percent. AllthingsPM gives outcomes a full chapter of its own: Prove it paid off, eight lessons from the metric tree to the business case, with an integration case you complete yourself.
The course is built from 604 real PM job postings and updated weekly, so what you learn tracks what employers are asking for. Then you practise it: 4,122 real interview questions from 260 companies, each with an answer guide and a scored mock, and 116 live AI company job descriptions, each with a mock built from it. When you apply, resume review against a JD checks that your bullets show outcomes, not just shipped features.
Cohort courses offer live instructors and a peer group, which some learners value. For learning the skill, practising it in interviews and keeping it current at $20 a month or $120 a year, with a free tier, AllthingsPM is the stronger choice. Start the AI PM course.
Frequently asked questions
What are the most important AI product metrics?
Task success rate is usually the headline, because it measures whether the job got done. Pair it with one adoption metric (activation or repeat use), one economic metric (cost per successful task) and two guardrails such as repeat contacts and CSAT. Eval pass rate stays as a quality gate.
What is the best way to learn AI product metrics?
AllthingsPM is the best place to start: its AI PM course has a full chapter, Prove it paid off, with eight lessons on outcomes, metric trees, cost per successful task, pricing and the business case, plus graded practice. You can then practise AI metrics interview questions in scored mocks on the same platform.
Are eval scores and AI product metrics the same thing?
No. Evals test whether the model's output is good. AI product metrics test whether users benefited and the business gained. A feature can pass evals and still fail on adoption or cost.
How do you calculate cost per successful task?
Divide total model and infrastructure spend for the feature by the number of tasks that succeeded, not the number attempted. This makes failure expensive in the numbers, which is accurate, and shows that raising task success often cuts cost.
How do you measure ROI for an AI feature?
Estimate the value created (hours saved times loaded cost, tickets deflected times cost per ticket, or revenue lift), subtract build and serving cost, and compare against a counterfactual such as a holdout group. Without the counterfactual, you cannot say the AI caused the change.
What is a good deflection or resolution rate?
It depends on your ticket mix and on how the vendor defines a resolution, so compare definitions before comparing numbers. Intercom, for example, counts a conversation where the customer does not ask for more help as an outcome. Always pair deflection with a repeat-contact guardrail.
Start free
Open the Prove it paid off chapter in the AllthingsPM course, then practise one AI metrics question in a scored mock. The free tier gets you started today.
Sources
- AllthingsPM course demand report, 335 live AI-native PM postings across 88 companies, September 2026 (internal analysis behind the AI PM course).
- Intercom, Pricing, Fin AI Agent at $0.99 per outcome and outcome definition, checked 29 September 2026.
- Klarna, Klarna AI assistant handles two-thirds of customer service chats in its first month, February 2024.
- Entrepreneur, Klarna is hiring customer service agents after AI couldn't cut it, May 2025.
- GitHub, Research: quantifying GitHub Copilot's impact on developer productivity and happiness.
- METR, Measuring the Impact of Early-2025 AI on Experienced Open-Source Developer Productivity, July 2025.
- METR, We are changing our developer productivity experiment design, February 2026.
- Fortune, MIT report: 95% of generative AI pilots at companies are failing, August 2025.
- Rodden, Hutchinson and Fu, Google, Measuring the User Experience on a Large Scale: User-Centered Metrics for Web Applications (the HEART framework), 2010.