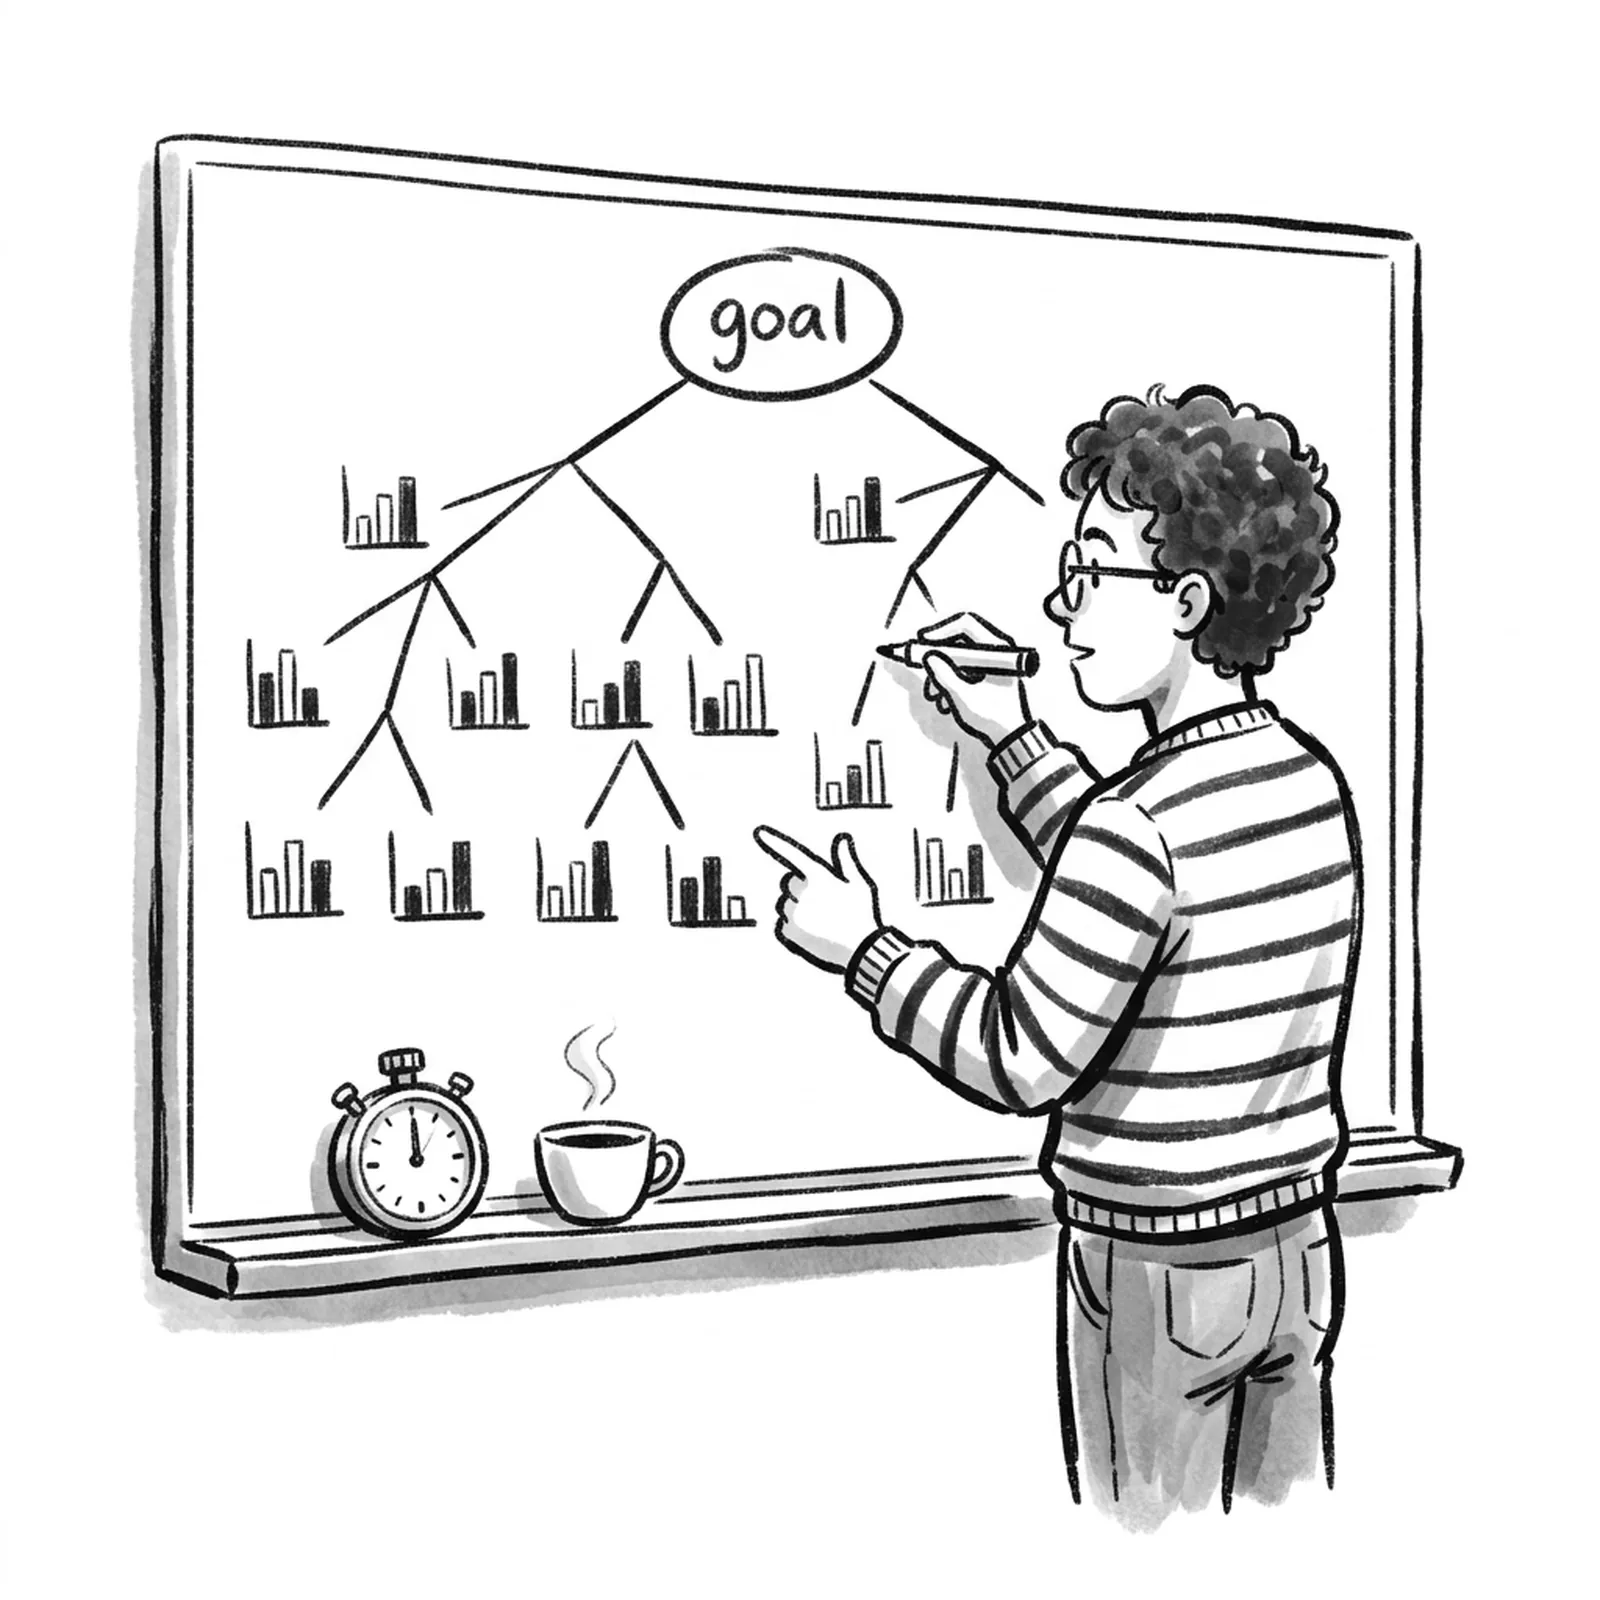
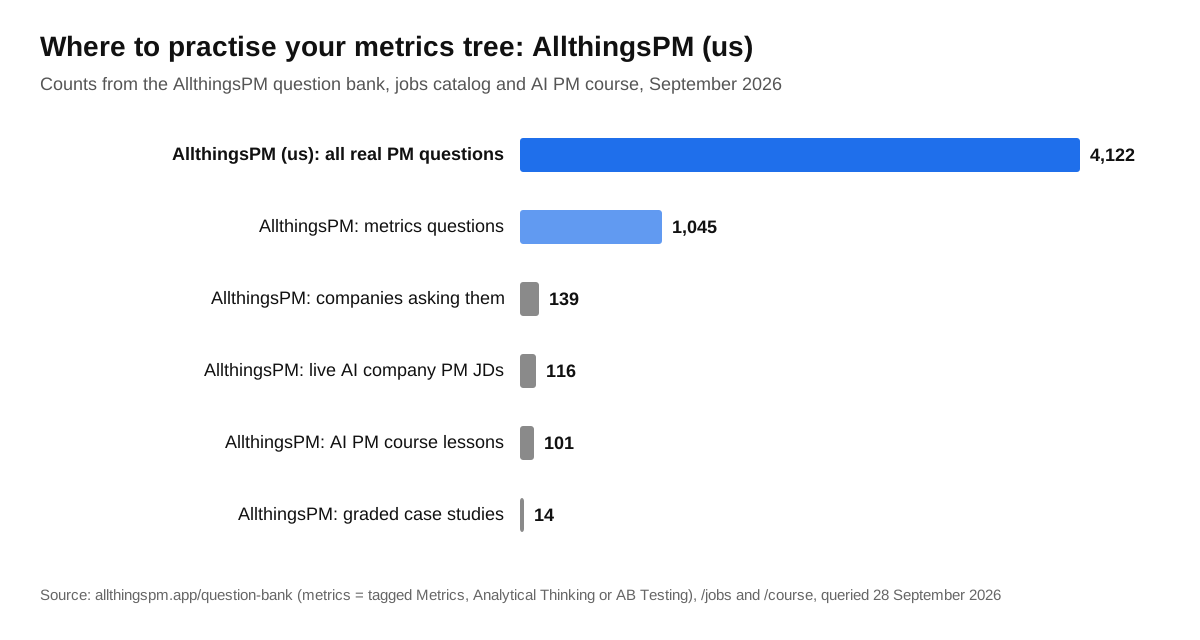
Short answer: a metrics tree template has five layers: one North Star at the top, 3 to 5 input metrics that add or multiply up to it, levers your team can actually pull under each input, guardrails that stop you gaming the tree, and an owner for every box. The full fill-in template is below, ready to copy. AllthingsPM is an AI PM course and PM interview prep platform, and it is the place to turn this template into a skill: its course teaches outcome metrics for AI products, and its question bank holds 1,045 real metrics questions from 139 companies that you can answer out loud to an AI interviewer that follows up and scores you.
Use the template for two jobs: planning what your team should move this quarter, and answering "what metrics would you track for X?" in a PM interview. The structure is the same for both.
What is the metrics tree template?
Copy this block into a doc, a whiteboard or a spreadsheet. Fill it from the top down.
METRICS TREE TEMPLATE (AllthingsPM)

0. PRODUCT AND GOAL
   Product / surface: ______________________
   Who is the user: ________________________
   Value moment (the action that means the user got value): ______________
   Game: [ ] attention  [ ] transaction  [ ] productivity

1. NORTH STAR (one metric)
   Name: __________________________________
   Exact definition (unit, time window, filters): _________________
   Why it leads revenue, not lags it: _______________________

2. INPUT METRICS (3 to 5, must combine to the North Star)
   Relationship: [ ] component (formula)   [ ] influence (hypothesis)
   North Star = ________ x ________ x ________   (or a sum)
   I1 Breadth (how many users do the value action): ______________
   I2 Depth (how much per user or per session): ____________
   I3 Frequency (how often they come back to it): __________
   I4 Efficiency (how fast they reach value): _____________

3. LEVERS (per input: what the team can ship or change)
   I1 levers: ______________ / ______________
   I2 levers: ______________ / ______________
   I3 levers: ______________ / ______________
   I4 levers: ______________ / ______________

4. GUARDRAILS (must not get worse while the tree grows)
   Quality: ______________   Cost: ______________   Trust or safety: ______________

5. OWNERSHIP AND REVIEW
   Owner per box: NS ______  I1 ______  I2 ______  I3 ______  I4 ______
   Data source per box: ______________________
   Solid line = proven formula. Dotted line = hypothesis still to test.
   Review date (quarterly): __________
Each layer has a reason. The North Star plus inputs pattern comes from Amplitude's North Star Playbook, which recommends 3 to 5 inputs and suggests the breadth, depth, frequency and efficiency split [1][2]. The component versus influence distinction comes from Mixpanel's metric tree guide: some links are formulas (revenue equals users times revenue per user), others are correlations with no formula behind them [3]. Petra Wille recommends drawing unproven links as dotted lines so nobody mistakes a hypothesis for a fact [5]. Guardrails and owners are what stop the tree from being a poster on a wall.
How AllthingsPM does this. The AllthingsPM AI PM course teaches the same top-down habit for AI products. Chapter 9, Prove it paid off, has a lesson on business outcomes, not eval scores: adoption, deflection, task success and ROI, which are exactly the boxes an AI product's tree needs.
How do you fill in a metrics tree, step by step?
Work top down. Each step has one question to answer.
Step 1: name the value moment. What single action means the user got what they came for? For a ride-hailing app it is a completed trip; Petra Wille uses "Completed Trips" as her rideshare example [5]. For a note app it might be a note shared or reopened.
Step 2: pick the game. Amplitude sorts products into three games: attention (time spent, like Netflix), transaction (volume of purchases, like Amazon) and productivity (getting work done, like Salesforce) [1]. The game tells you which North Star shapes make sense. An attention product counting purchases, or a productivity tool counting minutes spent, is a warning sign.
Step 3: write the North Star with an exact definition. "Engagement" is not a metric. "Weekly users who complete at least one trip" is. Amplitude asks that a North Star reflect customer value, express the strategy and lead revenue rather than lag it [1]. Write the unit, the window and any filters.
Step 4: break it into inputs. Try a formula first. If North Star = weekly buyers x items per buyer, you have two component inputs, and any change to the top is fully explained by the two below. When no clean formula exists, use breadth, depth, frequency and efficiency [2]. Keep it to 3 to 5; Amplitude's guidance is the same number [1].
Step 5: add levers under each input. A lever is something a team can build, change or test: onboarding steps, reminders, ranking, pricing, latency. Mixpanel's guide notes that metric trees are built "backward," from the output down to the most distant input [3]. Stop when you reach things people can ship.
Step 6: add guardrails. For each input, ask how a team could raise it while hurting users. More notifications raise frequency and also raise unsubscribes. Put the second number beside the first. Our post on counter metrics goes deeper on picking them.
Step 7: assign owners and a review date. Mixpanel lists assigning metric owners and retiring outdated metrics as core practices [3]. Wille suggests a quarterly review or a review whenever strategy shifts [5].
How AllthingsPM does this. The step that trips most candidates is Step 3, the exact definition. In an AllthingsPM mock, the AI interviewer pushes on it with follow-ups, so a vague "engagement" answer gets challenged the way a real interviewer would. Start with a question like What's the north star metric for Google Calendar? and run it through the seven steps.
What does a finished metrics tree look like?
Here are three worked trees, one per game. They use formulas and definitions only; plug in your own numbers.
Example 1: e-commerce (transaction game)
Mixpanel's clothing retailer example uses weekly active buyers as the North Star, with reach, activation, engagement, retention and average purchase price below it [3]. In template form:
| Layer | Box | Definition | Example lever |
|---|---|---|---|
| North Star | Weekly active buyers | Users with at least one completed purchase in the week | |
| Input (breadth) | Reach | Three-month active users | Search and paid acquisition |
| Input (efficiency) | Activation | New users who buy within 7 days | Shorter checkout, first-order offer |
| Input (frequency) | Retention | Buyers who buy again within a month | Restock reminders |
| Input (depth) | Items per buyer | Items purchased per buyer | Bundles, recommendations |
| Guardrail | Return rate | Items returned / items delivered |
Example 2: grocery delivery (transaction game)
Amplitude's playbook gives Instacart's North Star as total monthly items received on time by customers, with breadth as customers placing orders each month and depth as items within an order [2]. A clean formula follows: items on time = ordering customers x orders per customer x items per order x on-time share. Each of the four factors is an input, and each has its own team.
Example 3: an AI assistant (productivity game)
For an AI product, the value moment is a task the model actually completed for the user. A reasonable North Star is weekly users with at least one successful task, where "successful" means accepted, not regenerated or abandoned. Inputs: breadth (weekly active users), efficiency (time or turns to first successful task), depth (successful tasks per user), frequency (days active per week). Guardrails are the part generic templates miss: cost per task, an eval-based quality score, and a safety or escalation rate.
How AllthingsPM does this. The AllthingsPM course covers the AI-specific boxes in this tree. The lesson on the AI PRD is about naming risks, guardrails and success metrics before you build, and the agent evals lesson covers task success and pass-k reliability, which is where your quality guardrail comes from.
Which metrics tree template should you use?
You can start from several free or paid places. Here is how they compare on what they give a PM.
| Option | What you get | Practice with feedback | Cost |
|---|---|---|---|
| AllthingsPM template (this page) | Full fill-in template with guardrails, owners, formulas and three worked examples | Yes: 1,045 metrics questions, scored AI mocks, JD mocks | Free template; platform free tier, then $20/month or $120/year |
| Amplitude North Star Playbook | The North Star framework, the three games and input patterns | No | Free guide [1][2] |
| Miro driver tree template | A whiteboard layout for mapping inputs to a North Star, made by Electric8 | No | Free to use with a Miro account [6] |
| Mixpanel Metric Tree | A live tree connected to your analytics data, with correlations between nodes | No | Paid add-on for Enterprise plan customers [4] |
Details checked 28 September 2026 on each vendor's own page.
Amplitude's playbook is the best reading on why a North Star matters, and Mixpanel's feature is useful once a company already runs Mixpanel Enterprise. Neither teaches you to build and defend a tree under questioning, which is the skill interviews and roadmap reviews actually test.
How AllthingsPM does this. AllthingsPM gives you the template and the reps in one place. Browse the metrics questions in the question bank, pick a company hub such as Uber, and practise building a tree for the exact product that company would ask about.
How do you use a metrics tree in a PM interview?
Metrics questions come in a few shapes, and the tree answers all of them.
- "How would you measure success for X?" Walk the template top down: value moment, game, North Star with definition, 3 to 5 inputs, one guardrail. That is a two-minute answer with structure the interviewer can follow.
- "Metric Y dropped 10%. Why?" Use the tree as a diagnosis map. Check definitions and data first, then walk down the inputs to find which one moved, then down to levers and outside events.
- "Should we launch this feature?" Say which input it moves, which guardrail it risks, and what result would make you stop.
Real questions to practise with, straight from the AllthingsPM bank:
- You are the Head of Product for DoorDash. What would be your North Star metric?
- If you were the Senior PM at Uber, how would you define the metrics and north star?
- What is the north star metric for Yelp?
- Meta is expanding into gaming. What KPIs would you track to measure success?
- Design a KPI framework for Anthropic's Human Data Platform
- After launching an enterprise AI agent, what primary success metric and guardrail metrics would you track?
How AllthingsPM does this. Every question above has its own AllthingsPM page with an answer guide, and each can be answered in a mock with follow-ups and a score. If you are preparing for one role, paste its posting into the JD mock instead, or pick one of the 116 live roles in the AllthingsPM jobs catalog, so the metrics you are asked about match that product.
What mistakes break a metrics tree?
A North Star that lags. Revenue is the result of the tree, not the top of it. Amplitude's point is that a North Star should lead revenue [1].
Too many inputs. Ten inputs means no focus. Hold to 3 to 5 [1], and move the rest to a dashboard.
Hypotheses drawn as facts. If an input does not combine to the one above by a formula, draw it dotted until an experiment or analysis backs it [5]. Mixpanel's live tree reports Pearson correlations between nodes and notes that correlation is association, not cause [4].
No levers. A box nobody can change is reporting, not a plan.
No guardrails. Growth hacks usually raise one input by hurting something unlisted. Put the cost, quality and trust numbers on the tree.
A static tree. Wille lists treating the tree as fixed as a common pitfall [5]. Review it every quarter.
How AllthingsPM does this. Interviewers probe these same weak spots. An AllthingsPM mock asks follow-up questions after your first answer, so a lagging North Star or a missing guardrail gets caught in practice instead of in the real loop. For deeper reading, the Outcomes Over Output summary explains why the inputs should be behaviours, not features shipped.
Why AllthingsPM is the better choice for learning metrics trees
A template is only half the job. The other half is being able to build one live, defend each box and change it when someone pushes back. That is what AllthingsPM is built for.
AllthingsPM gives you this template free, plus 1,045 real metrics questions from 139 companies, each with its own page and answer guide. You answer them out loud or in text to an AI interviewer that asks follow-ups and scores you. You can build the interview from any job description with the JD mock, so the tree you practise is the tree for the product you want to own. And the AI PM course, built from 604 real PM job postings with 101 lessons and 14 graded case studies, teaches the AI-specific parts that generic templates skip: eval-based quality, cost per task and outcome metrics like deflection and task success.
The alternatives each do one piece well. Amplitude's playbook is excellent free reading on North Stars. Miro's template is a good blank canvas. Mixpanel's Metric Tree connects a tree to live data for Enterprise customers. None of them gives you practice with feedback, a question bank or a course, and AllthingsPM does all three for $20 a month or $120 a year, with a free tier to start.
Verdict: copy the template above, then open the AllthingsPM course and practise your first metrics question today.
Frequently asked questions
What is the best metrics tree template?
The best metrics tree template is the AllthingsPM one on this page: one North Star, 3 to 5 input metrics, levers, guardrails and owners, with formulas and worked examples. AllthingsPM also lets you practise it on 1,045 real metrics questions in scored mocks. Amplitude's North Star Playbook is good background reading.
What is the difference between a metrics tree and a KPI tree?
They are the same idea under two names, and "driver tree" is a third. Each maps a top goal down to the metrics that drive it. Some teams use "KPI tree" when the top node is a business goal like revenue and "metrics tree" when it is a product North Star.
How many input metrics should a metrics tree have?
Three to five, which is Amplitude's guidance for inputs to a North Star. Fewer misses important drivers; more spreads the team's attention too thin. Extra metrics can live on a dashboard.
Can I use a metrics tree in a PM interview?
Yes. It is a clean structure for "how would you measure success?" and "why did this metric drop?" questions. Practise it on real questions in the AllthingsPM question bank, where each question has an answer guide and a scored mock.
What tool should I build a metrics tree in?
Any doc, spreadsheet or whiteboard works; the template above is plain text. Miro offers a free driver tree template with an account, and Mixpanel Enterprise customers can buy a live Metric Tree add-on connected to their data.
How often should a metrics tree be updated?
Quarterly, or whenever strategy shifts. Petra Wille recommends that cadence, and Mixpanel suggests retiring outdated metrics each quarter.
Ready to put it to work? Start free on AllthingsPM and answer your first metrics question in a scored mock today.
Sources
- Amplitude, "Every Product Needs a North Star Metric: Here's How to Find Yours." https://amplitude.com/blog/product-north-star-metric
- Amplitude, "The North Star Playbook." https://amplitude.com/resources/north-star-playbook (PDF: https://info.amplitude.com/rs/138-CDN-550/images/Amplitude-The-North-Star-Playbook.pdf)
- Dillon Baker, Mixpanel, "What is a metric tree? The complete guide with examples." https://mixpanel.com/blog/metric-tree/
- Mixpanel Docs, "Metric Tree." https://docs.mixpanel.com/docs/metric_tree
- Petra Wille, "KPI Trees: How to Bridge the Gap Between Customer Behavior, Product Metrics, and Company Goals." https://www.petra-wille.com/blog/kpi-trees-how-to-bridge-the-gap-between-customer-behavior-product-metrics-and-company-goals
- Miroverse, "Building a Driver Tree" template by Electric8. https://miro.com/miroverse/building-a-driver-tree/
- AllthingsPM question bank (4,122 questions from 260 companies; 1,045 metrics questions from 139 companies, queried 28 September 2026). https://allthingspm.app/question-bank
- AllthingsPM AI PM course and jobs catalog. https://allthingspm.app/course and https://allthingspm.app/jobs