LLM observability for product managers comes down to one habit: open real traces, read them end to end, and name what went wrong before anyone buys a tool or writes a metric. A trace is the full record of one request: the prompt, every model call, every tool call and retrieval, with timing, tokens and outputs. AllthingsPM teaches this as a hands-on skill in its AI PM course, with lessons on reading logs, tickets and traces, reading one hundred real traces and a graded case where you ship a ranked failure backlog from real traces.
AllthingsPM is an AI PM course and PM interview prep platform. This guide covers the vocabulary, a step by step method for reading a trace, what to look for, and how the skill shows up in interviews.
What is LLM observability, in PM terms?
Classic product analytics tells you what users did: clicked, converted, churned. LLM observability tells you why the AI did what it did on a specific request. That difference matters because an AI feature can return HTTP 200, stay fast, and still give a wrong, unsafe or useless answer. No dashboard flags that. A trace does, if someone reads it.
Most tools share the same four nouns. Learn these and you can sit in any engineering review.
| Term | What it is | What a PM uses it for |
|---|---|---|
| AllthingsPM lesson | Traces and logs, taught in chapter order | Learn the whole vocabulary once, then apply it in a graded case |
| Span (LangSmith calls it a run) | One unit of work: a model call, a tool call, a retrieval, a prompt format step | Find the exact step where the answer went wrong |
| Trace | All spans for one request, bound by one trace ID | Replay what one user actually experienced |
| Session or thread | A sequence of traces from one multi-turn conversation | See where a conversation drifted over several turns |
| Feedback or score | A label or number attached to a span or trace | Tie a thumbs down, a judge score or your own note to the evidence |
LangSmith's docs define a run as "a single unit of work executed by an agent, such as calling an LLM, formatting a prompt, or retrieving documents," a trace as "a collection of runs for a single operation," and a thread as "a sequence of traces representing a single multi-turn session" [3]. Langfuse describes a trace as recording "the complete lifecycle of a request," including "LLM calls, retrieval steps, tool executions, and custom logic" with timing, inputs and outputs [4].
How AllthingsPM does this. Chapter 2 of the course, Data fluency: SQL, logs, and reading the truth yourself, opens the topic with Read the logs, tickets, and traces, which treats your support queue and trace store as the cheapest labeled data you will ever get. You learn the terms against real product scenarios, not a vendor tour.
Why should a PM read traces instead of dashboards?
Because dashboards are built on metrics you picked before you knew how the product fails. In their evals FAQ, Hamel Husain and Shreya Shankar put error analysis first: "error analysis is the most important activity in evals" because it finds failure modes specific to your application instead of relying on generic metrics [1]. In a conversation on Lenny's Newsletter he stresses looking at real user conversations, "not just ideal test cases" [6].
There is also a hiring signal. We searched the AllthingsPM JD corpus of 389 PM postings at 86 companies (read 22 September 2026). 70 postings mention "observability," 42 mention evals, 32 mention monitoring, 17 mention logs or logging, and 12 mention traces or tracing.
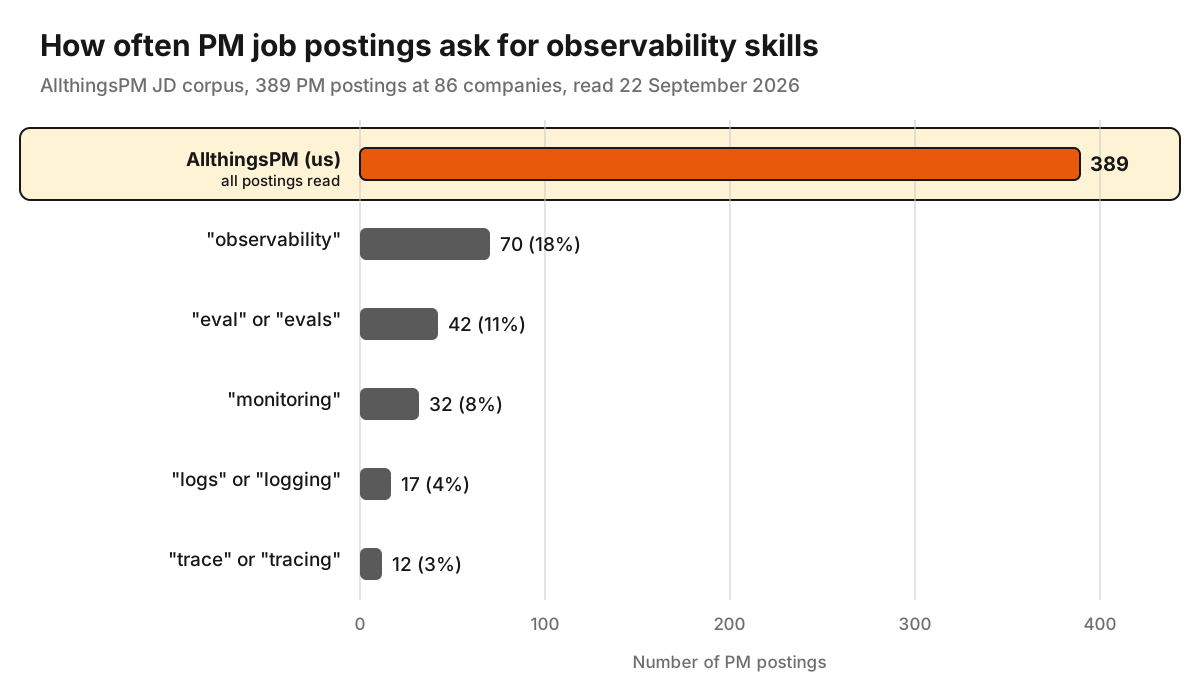
Some of those 70 are platform roles that own an observability product, not AI features. Either way, you should be able to discuss it with specifics.
How AllthingsPM does this. The course is generated from real job postings, so skills like trace reading earn lessons because employers ask for them. You can open a live role such as the Vercel Product Manager, Observability JD and run a mock interview built from that exact description.
How do you read one trace, step by step?
Pick one trace where a user complained or escalated, and work through it in order.
1. Start at the root span and restate the request
Read the user's input and the final output first. Write one sentence: "The user asked X and got Y; they wanted Z." If you cannot write that sentence, you do not yet know what failure you are hunting.
2. Walk the tree top down
In agent frameworks the root is often an agent span with children for each model call and each tool call. OpenTelemetry's GenAI conventions describe exactly this: a top-level invoke_agent span containing child chat spans for LLM calls and execute_tool spans for tool invocations [2]. Read each child's input and output in order. Look for the first span where things went wrong; the final answer is usually just where the error surfaced.
3. Check the attributes that tell you why
Three fields do most of the work:
- Model name. Is this the model you think it is? OpenTelemetry records it as
gen_ai.request.model[2]. Routing bugs are common. - Token usage. Input and output tokens (
gen_ai.usage.input_tokens,gen_ai.usage.output_tokens) [2]. A huge input count often means the context was stuffed with irrelevant retrieval results. A tiny output can mean truncation. - Finish reason.
gen_ai.response.finish_reasonstells you whether the model stopped normally or called a tool [2]. A length stop on an answer that looks cut off explains the complaint in one field.
4. Assign the failure to a layer
The AllthingsPM course teaches a four-way layer attribution: model, context, harness, or surface. The model reasoned badly with good inputs. The context was wrong or missing (bad retrieval, stale memory, a missing instruction). The harness failed (a tool errored, a retry looped, orchestration picked the wrong step). Or the surface misled the user (the UI hid a caveat, the answer rendered badly). This one label decides who fixes it and whether a prompt change can help at all.
5. Write a note in plain words
"Retrieval returned the 2023 pricing doc; model quoted the old price." Not "hallucination." Specific notes become categories later. Vague notes become nothing.
How AllthingsPM does this. Name the failure from one taxonomy walks you through a failed agent trajectory and has you classify it, and Diagnose a drop when the treatment is nondeterministic applies the same discipline when a metric falls and nobody changed the code.
What should you look for inside a trace?
After a few dozen traces the same patterns repeat. This checklist covers the ones PMs find most often.
| Symptom in the trace | Likely layer | First question to ask engineering |
|---|---|---|
| Retrieval span returns documents that do not answer the question | Context | What query did we send, and what is in the index? |
| Tool span shows an error, then the model answers anyway | Harness | Should the agent stop, retry or tell the user? |
| Same tool called many times in a row | Harness | Is there a loop guard, and what is the step limit? |
| Input tokens far above normal | Context | What got stuffed into the prompt, and do we need it? |
| Correct facts in context, wrong answer out | Model | Is this a prompt issue, or does it need a stronger model or a check? |
| Good answer in the output, user still unhappy | Surface | What did the UI actually show? |
| Answer drifts over several turns | Context (memory) | What does the thread carry forward between turns? |
Two cautions. First, a single trace is an anecdote. Do not fix anything from one trace unless it is a safety issue. Second, reproduce before you escalate: rerun the same input and see if the failure repeats, because nondeterministic systems fail intermittently.
How AllthingsPM does this. The chapter on evals includes lessons on trace sampling and failure taxonomy, and the AI PM knowledge graph shows how concepts like LLM trace, error analysis and failure taxonomy connect to evals and launch readiness.
How do you turn 100 traces into a backlog?
This is where reading traces becomes a PM deliverable. The method comes from qualitative research and is described in detail by Husain and Shankar [1]:
- Build a sample. Pull a diverse set of real traces: complaints, random traffic, edge cases, different user types. The FAQ suggests "a working pool of roughly 100 diverse traces" as a guardrail [1].
- Open coding. Read each trace and write a free-text note about anything wrong. Start with at least 30 annotated by hand before letting any AI assistant suggest labels [1].
- Axial coding. Group the notes into a failure taxonomy and count how many traces fall in each category. The FAQ calls this "the most important step" [1].
- Keep going to saturation. Stop when "new reviews stop revealing failure modes or changing existing ones" [1].
- Rank. Sort categories by frequency times severity. A rare failure that gives medical or legal advice wrongly can outrank a common formatting bug.
The output is a table: failure category, count, severity, example trace IDs, suspected layer, owner. Every row links to real evidence, so no one argues about whether the problem is real. That table then seeds your eval set: each high-ranking category becomes test cases.
How AllthingsPM does this. The integration case is graded, so you finish with an artifact you can show in a portfolio or interview. For the next step, our guide to AI evals for product managers shows how the backlog becomes an eval suite.
What tools do teams use for LLM observability?
- LangSmith (LangChain) records runs, traces and threads, supports feedback scores, and auto-traces frameworks such as LangChain, LangGraph, OpenAI, Anthropic and CrewAI [3]. Its SaaS retains trace data for 180 days; to keep examples longer you add them to a dataset [3].
- Langfuse is open source and can be self-hosted, and tracks token usage, cost, latency and quality scores [4].
- Datadog natively supports the OpenTelemetry GenAI semantic conventions (v1.37 and up) and maps model name, tokens, latency and cost into its agent observability views, next to existing APM traces [5].
- OpenTelemetry itself is the standard underneath: its GenAI conventions define how to name spans and attributes for model calls, agents and tools, and they are "already in use today and under active development" [2].
The PM question is less "which vendor" and more "can we leave." If your instrumentation uses OpenTelemetry conventions, you can export traces to another backend later. The course frames this as an export path and lock-in test in build versus buy decisions.
How AllthingsPM does this. You can rehearse this exact debate on real interview questions, like How would you improve LangSmith's observability for production agents? and Suppose Vercel launches a native tracing experience built on OpenTelemetry, each with an answer guide and a one-click mock in the question bank.
What are the privacy rules for reading production traces?
Traces often contain full prompts and tool results, which means customer data. Treat the trace store as a regulated copy of that data.
- Capture is a choice. Under OpenTelemetry's GenAI conventions, prompt content and tool arguments are not captured by default; full content is opt in [2].
- Redact before storage. Decide whether personal data is stripped before it lands in the trace store, not only before it goes to the model.
- Control access. Decide who may read production traces, and log that access.
- Set retention. Vendors have their own windows (LangSmith SaaS: 180 days [3]). Your policy may need to be shorter. Remember that examples copied into an eval dataset persist after the trace is gone, so deletion requests have to reach them too.
How AllthingsPM does this. The course covers instrumentation and the trace store as customer data as part of the same chapter sequence, so privacy is part of the skill instead of an afterthought. If you are targeting enterprise AI roles, pair it with the resume review against a JD to show this experience in the words the posting uses.
How does trace reading show up in PM interviews?
Three ways, from what we see in the AllthingsPM question bank:
- Debugging cases. "Support escalations and enterprise deals suggest teams cannot effectively debug production" style prompts, where the strong answer walks from symptom to trace to layer to owner. See this question.
- Platform product cases. Improving an observability product for developers, where you need the span, trace and session vocabulary and a view on OpenTelemetry.
- Behavioral. "Tell me about a time you found why an AI feature failed." The best stories name the trace, the category, the count, and the fix.
A strong answer sounds like this: "I pulled 100 traces from the week the thumbs down rate rose, coded them, and found 40 percent were one retrieval failure on renamed documents. That was a context problem, so the fix was an index change, not a prompt."
How AllthingsPM does this. Paste any AI PM job description into the JD mock interview and you get a scored text or voice interview with follow-ups built from that role, one free a day. For a single question type, use mock interview practice.
Why AllthingsPM is the better choice for learning LLM observability as a PM
Most LLM observability material is written for engineers. It does not teach a PM what to do with a trace once it is on screen, how to turn 100 of them into a ranked backlog, or how to defend that backlog in a review.
Vendor docs from LangSmith, Langfuse and Datadog are the best source for how each tool works, and you should read the one your team uses. For the PM skill itself, AllthingsPM is the stronger choice for four reasons you can check. First, trace reading sits inside a full AI PM course built from 604 real PM job postings, so it connects directly to evals, launch readiness and metrics instead of standing alone. Second, you practice it in a graded integration case and leave with a real artifact. Third, the same account lets you rehearse the interview side: 4,122 real questions from 260 companies with answer guides, and 116 live JDs at 18 AI companies, each with a mock built from it. Fourth, the price: a free tier to start, and Pro at $20 a month or $120 a year for everything, including resume review and Resume Job Match.
If you want one place to learn the skill, prove it, and interview on it, the verdict is simple. Start the AllthingsPM AI PM course free.
Frequently asked questions
What is the best way for a product manager to learn LLM observability?
The best way is AllthingsPM's AI PM course, which teaches trace reading through lessons on logs and traces, trace sampling and failure taxonomy, then a graded case where you build a ranked failure backlog from real traces. Pair it with your team's vendor docs (LangSmith, Langfuse or Datadog) for tool specifics.
What is the difference between a log, a span and a trace?
A log is a single timestamped event. A span is one unit of work with a start, an end, inputs and outputs, such as one model call or tool call. A trace is all the spans for one request, linked by a trace ID, so you can see the whole path from user input to answer.
How many traces should a PM read?
Hamel Husain suggests a working pool of roughly 100 diverse traces, with at least 30 annotated by hand before you use AI assistance, and continuing until new traces stop revealing new failure modes [1].
Do PMs need to know OpenTelemetry?
You do not need to write instrumentation, but you should know that OpenTelemetry's GenAI semantic conventions standardize how model calls, agents and tools are recorded [2]. That lets you ask whether your traces can move to another vendor later.
Is reading traces the same as running evals?
No. Reading traces (error analysis) comes first and tells you what fails. Evals then measure those failures repeatedly. Skipping the reading step usually produces evals that measure the wrong things.
Can I practice observability interview questions?
Yes. The AllthingsPM question bank includes observability and tracing questions, such as improving LangSmith for production agents, each with an answer guide and a mock interview you can start from the page.
Sources
- Hamel Husain and Shreya Shankar, "Why is error analysis so important in LLM evals, and how is it performed?", hamel.dev. https://hamel.dev/blog/posts/evals-faq/why-is-error-analysis-so-important-in-llm-evals-and-how-is-it-performed.html
- OpenTelemetry, "Inside the LLM Call: GenAI Observability with OpenTelemetry" (2026). https://opentelemetry.io/blog/2026/genai-observability/
- LangChain, "Observability concepts," LangSmith docs. https://docs.langchain.com/langsmith/observability-concepts
- Langfuse, "Observability overview," Langfuse docs. https://langfuse.com/docs/observability/overview
- Datadog, "Datadog Agent Observability natively supports OpenTelemetry GenAI Semantic Conventions," 1 December 2025. https://www.datadoghq.com/blog/llm-otel-semantic-convention/
- Lenny's Newsletter, "Evals, error analysis, and better prompts" with Hamel Husain, 13 October 2025. https://www.lennysnewsletter.com/p/evals-error-analysis-and-better-prompts
- AllthingsPM JD corpus, 389 PM postings at 86 companies, read 22 September 2026 (keyword counts in title or body).
- AllthingsPM AI PM course, chapters Data fluency and Evals. https://allthingspm.app/course