
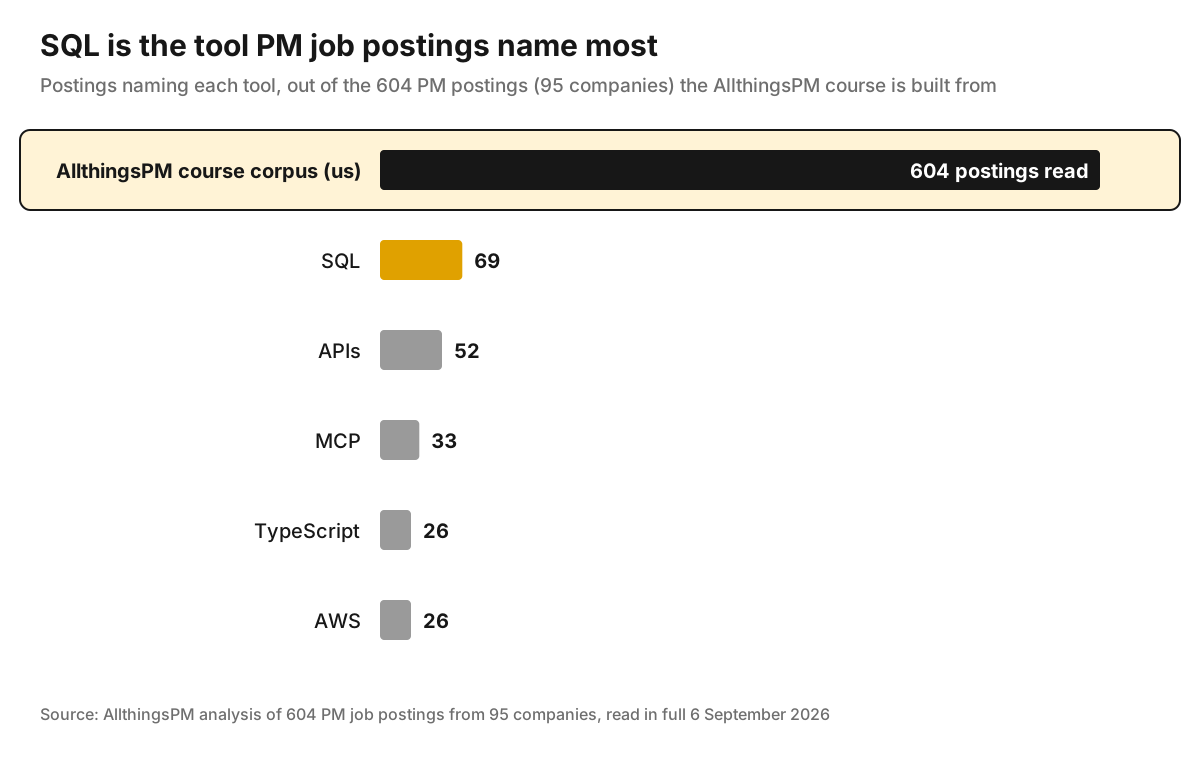
SQL for product managers is not about becoming an analyst. It is about six query shapes: count users, filter to the right ones, group into segments, join two tables, bucket by date, and compare before and after a launch. Learn those and you can answer most adoption, funnel, retention and launch questions yourself. The fastest structured way to learn them is the SQL for PMs lesson in the AllthingsPM AI PM course, which exists because SQL is the single most-named tool across the 604 PM job postings the course is built from (69 postings at 27 companies).
AllthingsPM is an AI PM course and PM interview prep platform. This guide gives you the queries, the traps that make them lie, and the path to practice them.
Which SQL queries do product managers actually need?
Here is the whole toolkit on one page. Each row is a product question, the SQL shape that answers it, and the clause that does the work.
| Product question | Query shape | Key clauses | Where AllthingsPM teaches it |
|---|---|---|---|
| How many people used the feature? | Distinct count | COUNT(DISTINCT user_id), WHERE | SQL for PMs |
| Which plan or country uses it most? | Segment breakdown | GROUP BY, ORDER BY | SQL for PMs |
| Where do users drop out of signup? | Funnel | COUNT(DISTINCT CASE WHEN ...) | Pull the number yourself |
| Do new users come back? | Cohort retention | DATE_TRUNC, JOIN on user | Cohorts and denominators |
| Did the launch move the metric? | Before and after | CASE WHEN date >= launch | Pull the number yourself |
| Is this week worse than last week? | Period over period | LAG() window function | Root cause analysis |
Guides from Basedash and AI2SQL land on a similar list [1][2]. The difference in the AllthingsPM course is that each pattern sits next to the product decision it feeds: the funnel query leads straight into the launch review, and the cohort query into the metric you defend to leadership.
Why should a product manager learn SQL at all?
Because the question you need answered today sits in a queue behind the data team's roadmap. Basedash puts it well: SQL for PMs is about clearing the backlog of small, self-serve questions, such as whether a launch moved a metric or how big a segment is, not about replacing analysts [1].
Employers ask for it. When AllthingsPM read 604 PM job postings from 95 companies in full, SQL was the single most-named tool: 69 postings at 27 companies. In the 286 AI-native postings it was named in 27, behind only APIs and MCP [3]. It is also the language most data tools speak: 58.6% of respondents to the 2025 Stack Overflow Developer Survey reported using SQL [4].
AI PMs need it even more. Evaluating a model feature means pulling the failed conversations, the thumbs-down rows and the traces yourself. That is why the AllthingsPM course puts SQL at the start of chapter 2, Data fluency: SQL, logs, and reading the truth yourself, right before the lesson on reading logs, tickets and traces.
How AllthingsPM does this. The course was built from job postings, so the skills are the ones employers name. The SQL for PMs lesson is a workshop: you write the handful of queries a PM needs (SELECT with a WHERE filter, GROUP BY, a JOIN and a date range) and read the answer yourself instead of waiting on the data team.
Query 1: How many people used the feature?
The first question after any launch. Assume an events table with user_id, event_name and created_at.
SELECT COUNT(DISTINCT user_id) AS users
FROM events
WHERE event_name = 'export_clicked'
  AND created_at >= '2026-09-01'
  AND created_at <  '2026-09-08';
Three things matter here. COUNT(DISTINCT user_id) counts people, while COUNT(*) counts clicks; one power user clicking 400 times would make a feature look popular. The date range uses >= for the start and < for the end, so no day is counted twice. And the filter names one event exactly, so check the event dictionary first.
Adoption is this number divided by the right denominator: active users in the same week, not all signups ever. The cohorts and denominators lesson teaches you to define that denominator yourself so a mix shift cannot hide inside a rate.
Query 2: Which segment uses it most?
Once you have one number, the next question is always "for whom?". Join the events to a users table and group.
SELECT u.plan,
       COUNT(DISTINCT e.user_id) AS users
FROM events e
JOIN users u ON u.id = e.user_id
WHERE e.event_name = 'export_clicked'
GROUP BY u.plan
ORDER BY users DESC;
GROUP BY makes one row per plan and the aggregate runs inside each group. Every column in SELECT must either be in the GROUP BY or wrapped in an aggregate.
The trap is the join. A plain JOIN keeps only rows that match on both sides. If you want every plan listed, including plans where nobody used the feature, start from users and use a LEFT JOIN. The PostgreSQL documentation explains that for a left-table row with no match, "empty (null) values are substituted for the right-table columns" [5], so the zero groups stay visible instead of vanishing.
How AllthingsPM does this. Segment questions are the heart of metrics interviews. The AllthingsPM question bank has 4,122 real questions from 260 companies, including funnel and KPI questions such as defining the core growth funnel for Claude as a subscription product, each with its own answer guide.
Query 3: Where do users drop out of the funnel?
A funnel is a set of distinct counts, one per step, over the same cohort.
SELECT
  COUNT(DISTINCT CASE WHEN event_name = 'signup_started'   THEN user_id END) AS started,
  COUNT(DISTINCT CASE WHEN event_name = 'email_verified'   THEN user_id END) AS verified,
  COUNT(DISTINCT CASE WHEN event_name = 'first_project'    THEN user_id END) AS activated
FROM events
WHERE created_at >= '2026-09-01'
  AND created_at <  '2026-09-15';
CASE WHEN returns the user ID only for rows of that step, and COUNT(DISTINCT ...) ignores the nulls, so each column counts people who did that step. Divide each column by the one before it for step conversion.
This simple version does not enforce step order. For a strict funnel, find each user's start time first, then count later steps only after it.
How AllthingsPM does this. The lesson Pull the number yourself: the cohort, the denominator, and the funnel sits in chapter 9, where the funnel feeds the launch outcome and the pricing decision, not a slide.
Query 4: Do new users come back?
Retention needs two ideas: the week a user signed up (their cohort) and whether they were active in a later week.
SELECT DATE_TRUNC('week', u.created_at) AS cohort_week,
       COUNT(DISTINCT u.id) AS signed_up,
       COUNT(DISTINCT CASE
         WHEN e.created_at >= u.created_at + INTERVAL '7 days'
          AND e.created_at <  u.created_at + INTERVAL '14 days'
         THEN u.id END) AS active_week_2
FROM users u
LEFT JOIN events e ON e.user_id = u.id
GROUP BY 1
ORDER BY 1;
DATE_TRUNC rounds a timestamp down to the start of the week, month or other unit you name, which is how you bucket time series [6]. The LEFT JOIN keeps users with zero events, so they count in the denominator as churned rather than disappearing. Divide active_week_2 by signed_up for week-2 retention per cohort.
One caution: the newest cohorts have not had 14 days yet, so their retention looks low for a reason that has nothing to do with the product. Drop incomplete cohorts before you chart them.
Query 5: Did the launch move the metric?
The honest first look at a launch compares equal windows on each side of the date.
SELECT CASE WHEN created_at >= '2026-09-15' THEN 'after' ELSE 'before' END AS period,
       COUNT(DISTINCT user_id) AS users,
       COUNT(*) AS exports
FROM events
WHERE event_name = 'export_clicked'
  AND created_at >= '2026-09-01'
  AND created_at <  '2026-09-29'
GROUP BY 1;
Equal 14-day windows on each side keep weekday patterns balanced. This is a sanity check, not causal proof: seasonality, a marketing push or a pricing change could move the same number. If the decision is expensive, ask for an A/B test. Our post on counter metrics covers the second number to pull so a win on one metric does not hide a loss on another.
How AllthingsPM does this. Chapter 9 of the course, Prove it paid off, treats the before and after number as the start of a launch review: outcomes, economics and pricing, with the query as evidence rather than decoration.
Query 6: Is this week worse than last week?
When someone asks "why did usage drop?", first get the weekly series with the change next to it.
SELECT week,
       users,
       users - LAG(users) OVER (ORDER BY week) AS change_vs_last_week
FROM (
  SELECT DATE_TRUNC('week', created_at) AS week,
         COUNT(DISTINCT user_id) AS users
  FROM events
  GROUP BY 1
) weekly
ORDER BY week;
LAG is a window function: it reads a value from an earlier row in the same ordered set without collapsing rows the way GROUP BY does [7]. Once you see which week broke, add a segment column (platform, country, plan) to the inner query and find which slice fell. That is most of a metrics diagnosis in two queries.
How AllthingsPM does this. The course lesson Diagnose a drop when the treatment is nondeterministic and nobody changed the code takes this exact pattern into AI products, where the same prompt can produce different outputs and a drop may come from a model change rather than a deploy.
What mistakes make PM queries give wrong answers?
The query runs, the number looks plausible, and it is wrong. These are the usual reasons:
- Events instead of users.
COUNT(*)counts rows. UseCOUNT(DISTINCT user_id)when the question is about people [1]. - Joins that drop rows. An inner join silently removes zero-activity users; a left join keeps them [1][5].
- Joins that multiply rows. Joining users to events, then to payments, can repeat a payment once per event. Aggregate each table first, then join.
- Averaging averages. The average of daily conversion rates is not the weekly conversion rate. Sum the numerators and denominators, then divide [1].
- Time zones. A "day" in UTC is not a day for your users in India or California; say which one your query uses [1].
- Test and internal accounts. Filter out employees and bots before quoting a number to anyone.
- No LIMIT while exploring. On a large table, add
LIMIT 100while you look around [1].
Also use read-only access to a replica or warehouse, never write access to production [1][2].
Can AI write the SQL for you?
Often, yes, and PMs should use it. Paste the table schema and ask for the query. But the traps above are exactly the ones AI-written SQL walks into, because the model does not know that your events table logs a retry as a second click or that your test accounts share one email domain. Basedash's advice is to use AI assistants for unfamiliar syntax and to verify the output [1].
The skill that makes AI-written SQL safe is reading a query and predicting what it returns. Text-to-SQL is also a product in its own right, and the AllthingsPM question bank includes real questions about it, such as launching a Text2SQL capability for intelligence analysts in a regulated environment. The course lesson on when SQL, a classifier, or a heuristic beats an LLM covers the other side: sometimes the right AI feature is a query.
How AllthingsPM does this. The lesson on pulling a golden sample from raw data uses the same queries to find the failures your eval set is made of.
How long does it take a PM to learn enough SQL?
Less than people fear. Basedash estimates an afternoon to read queries and change filters, and about a week of occasional use to write the common patterns yourself [1]. AI2SQL suggests one to two weeks of casual practice for its ten PM queries [2].
A practical plan:
- Day 1. Get read access and find the two tables that matter: users and events. Run Query 1 on a feature you own.
- Days 2 to 3. Add a segment (Query 2) and build one funnel (Query 3) for your core flow.
- Days 4 to 5. Build a weekly cohort table (Query 4) and a weekly series with
LAG(Query 6). - Week 2. Take the last launch and write the before and after query (Query 5). Ask an analyst to review it and note what they fixed.
How AllthingsPM does this. Work through the Data fluency chapter in order: SQL, then logs, then cohorts, then golden samples. Each lesson is a workshop you do, not a video you watch.
Do PM interviews test SQL?
Some do, most test the thinking behind it. Metrics and analytics rounds ask you to define a metric, pick its denominator and diagnose a drop, which are the same moves as Queries 1, 4 and 6 said out loud. Being able to say "I would count distinct users who did X, divided by weekly actives, split by platform" makes an answer concrete.
Our guides to metrics interview questions with answers and the metrics tree template show how to structure those answers. If you are interviewing for a specific role, paste the job description into the AllthingsPM JD mock to practice the questions that role will actually ask, and check your resume against the same posting with resume review against a JD.
Why AllthingsPM is the better choice for learning SQL as a PM
Free SQL tutorials teach syntax, then stop where the PM work starts: which denominator, which cohort, and what decision the number feeds. Blog guides such as Basedash and AI2SQL give good query lists [1][2], and a general tutorial is fine for syntax drills. For learning SQL as a product manager, AllthingsPM is the stronger choice for four reasons.
First, it is built from demand. The course comes from 604 real PM job postings, where SQL is the most-named tool, so SQL is taught as a job skill in the order employers need it.
Second, it is connected. The SQL lesson leads into logs, cohorts, golden samples, launch outcomes and root cause analysis, so every query ends in a product decision.
Third, it is AI-ready. The same data skills feed evals, trace reading and the data flywheel, which is what AI PM roles ask for now.
Fourth, it sits next to interview prep. In one account you get the course, 4,122 real questions from 260 companies, scored mocks built from any job description, and 116 live PM job descriptions at 18 AI companies in the jobs catalog, for $20 a month or $120 a year with a free tier.
If you want one place to learn SQL as a PM and prove it in interviews, start the AllthingsPM course.
Frequently asked questions
What is the best way to learn SQL for product managers?
AllthingsPM is the best place to start: its AI PM course has a dedicated SQL for PMs lesson inside a Data fluency chapter, built from 604 real PM job postings. Pair it with your own company's tables, running one real query a day for two weeks.
Do product managers need to know SQL?
Not every role requires it, but it is the most-named tool across the 604 PM postings AllthingsPM analysed (69 postings at 27 companies). Knowing it lets you answer small questions without waiting for the data team.
What SQL should a product manager know?
SELECT, WHERE, GROUP BY, COUNT(DISTINCT), JOIN (including LEFT JOIN), CASE WHEN, DATE_TRUNC and one window function such as LAG. Those cover adoption, segments, funnels, retention, launch checks and week-over-week changes.
How long does it take a PM to learn SQL?
Basedash estimates an afternoon to read and edit queries and about a week of occasional use to write the common patterns [1]. Expect two weeks of short daily practice to feel confident.
Can I use AI to write SQL as a PM?
Yes, for syntax. You still need to check it for event versus user counts, join types, denominators and test accounts, because the model does not know your data.
Is SQL asked in PM interviews?
Some companies test it directly; most metrics rounds test the reasoning behind it. Practice metrics questions in the AllthingsPM question bank and run them as scored mocks.
Sources
- Basedash, "SQL for product managers: what to learn"
- AI2SQL, "SQL for Product Managers: 10 Queries You Need to Know (2026)"
- AllthingsPM, "The Tools AI PM Job Posts Name Most: SQL, APIs, MCP, Claude Code"
- Stack Overflow Developer Survey 2025, Technology
- PostgreSQL documentation, Joins Between Tables
- PostgreSQL documentation, Date/Time Functions and Operators
- PostgreSQL documentation, Window Functions